Introduction
The Average Directional Index (ADX) is a popular technical indicator used by Forex traders to gauge the strength of a trend and identify potential trading opportunities. By understanding the nuances of the ADX, traders can make more informed decisions and improve their overall trading performance. In this article, we’ll explore the intricacies of the Average Directional Index (ADX), how it can be combined with other Forex trading indicators, and practical tips for using it in your trading strategy.
Understanding the Average Directional Index (ADX)
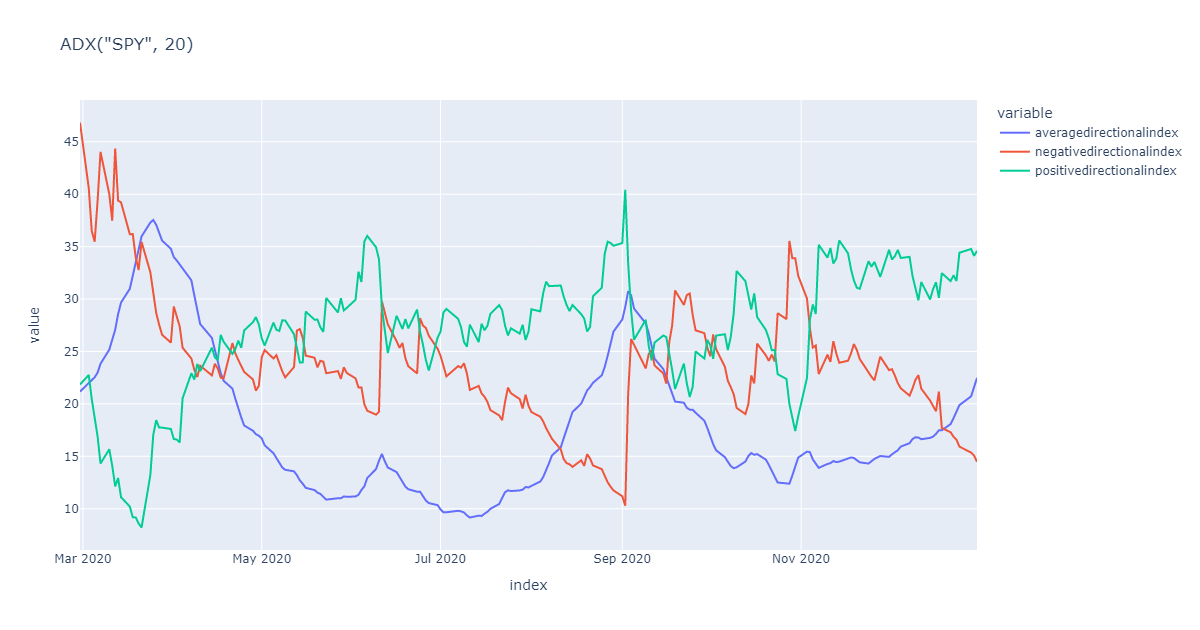
Developed by J. Welles Wilder Jr. in 1978, the Average Directional Index (ADX) is designed to quantify trend strength without regard to direction. The ADX is composed of three components: the Positive Directional Indicator (+DI), the Negative Directional Indicator (-DI), and the Average Directional Movement Index (ADX line).
The Positive Directional Indicator (+DI) measures the strength of upward price movement and is used to assess the strength of the bullish trend. On the other hand, the Negative Directional Indicator (-DI) measures the strength of downward price movement and is used to assess the strength of the bearish trend. Lastly, the Average Directional Movement Index (ADX line) is derived from the +DI and -DI values and represents the overall trend strength, regardless of direction.
Calculating the Average Directional Index (ADX)
The ADX is calculated through a series of steps, involving the calculation of True Range (TR), +DI and -DI, the Directional Movement Index (DMI), and the ADX line.
First, the True Range (TR) is calculated as the greatest value among the current high minus the current low, the absolute value of the current high minus the previous close, and the absolute value of the current low minus the previous close. Next, the +DI and -DI are calculated by dividing the smoothed +DM (positive directional movement) and -DM (negative directional movement) by the smoothed TR and then multiplying by 100.
Following this, the Directional Movement Index (DMI) is derived by finding the absolute difference between +DI and -DI, dividing the result by the sum of +DI and -DI, and then multiplying by 100. Finally, the ADX line is calculated by smoothing the DMI values over a specified period (usually 14 days) and multiplying by 100.
Interpreting the Average Directional Index (ADX)
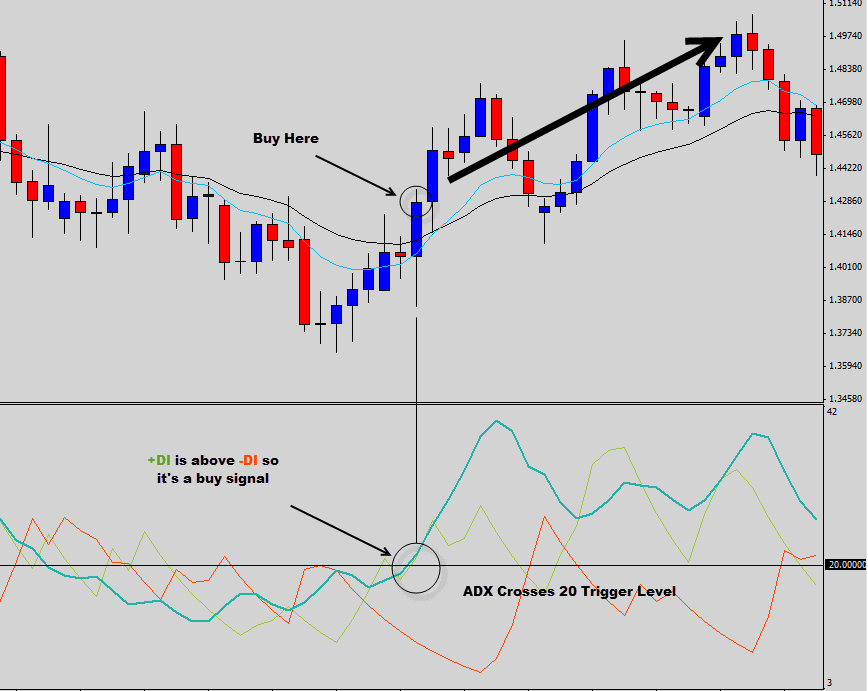
The ADX can provide valuable insights into trend strength and direction, helping traders identify potential trade setups. The ADX line ranges between 0 and 100, with higher values indicating stronger trends. Generally, an ADX value above 25 suggests a strong trend, while a value below 20 indicates a weak or non-existent trend.
Additionally, the +DI and -DI lines can help traders determine trend direction. When the +DI is above the -DI, it indicates a bullish trend, and when the -DI is above the +DI, it signals a bearish trend. Crossovers between the +DI and -DI lines can also serve as potential trade entry or exit signals.
Combining the ADX with Other Forex Trading Indicators
Integrating the ADX with other technical indicators can improve the accuracy and reliability of trading signals. By combining multiple indicators, traders can reduce false signals, enhance trade confirmation, and better manage risk. Here are some popular Forex trading indicators that can be combined with the ADX:
- ADX and Parabolic SAR: The Parabolic SAR is an indicator that helps traders identify potential reversal points and trends. By combining the ADX and Parabolic SAR, traders can gauge trend strength and use the Parabolic SAR to pinpoint entry and exit points. When the ADX indicates a strong trend and the Parabolic SAR provides a buy or sell signal, it can increase the probability of a successful trade.
- ADX and Moving Averages: Moving averages (MAs) are widely used to identify trends and potential support and resistance levels. When the ADX indicates a strong trend, traders can use moving averages to determine the direction of the trend. For example, if the price is above the moving average and the ADX indicates a strong trend, it may signal a bullish market condition. Conversely, if the price is below the moving average and the ADX shows a strong trend, it may signal a bearish market condition.
- ADX and RSI: The Relative Strength Index (RSI) is an oscillator that measures the strength of price movements and can help traders identify overbought or oversold conditions. By combining the ADX with the RSI, traders can assess trend strength while also determining potential overbought or oversold levels. When the ADX indicates a strong trend and the RSI shows overbought or oversold conditions, it may signal an impending trend reversal.
- ADX and MACD: The Moving Average Convergence Divergence (MACD) is a trend-following and momentum indicator that can help traders identify trend direction and potential reversal points. Combining the ADX with the MACD allows traders to gauge trend strength and use the MACD’s crossover signals to identify potential trade entries or exits. When the ADX indicates a strong trend and the MACD provides a buy or sell signal, the probability of a successful trade increases.
- ADX and Bollinger Bands: Bollinger Bands are volatility bands that can help traders identify potential breakouts and reversals. When the ADX indicates a strong trend, traders can use Bollinger Bands to assess market volatility and find potential trade entry points. For example, when the price is near the upper or lower Bollinger Band and the ADX shows a strong trend, it may signal a potential breakout or reversal.
Practical Tips for Using the ADX in Your Trading Strategy
To make the most of the ADX, traders should consider the following practical tips:
- Setting up the ADX on your trading platform: Most trading platforms have the ADX built-in as a standard indicator. Familiarize yourself with the platform’s settings and customize the ADX period and visual representation according to your preferences.
- Adapting the ADX to different timeframes: The ADX can be applied to various timeframes, from intraday to long-term trading. Keep in mind that the ADX values might behave differently across timeframes, so adjust your trading strategy accordingly.
- Managing risk with the ADX: While the ADX helps identify trend strength and direction, it does not provide specific stop-loss or profit target levels. Combine the ADX with other risk management tools, such as support and resistance levels, to protect your trading capital.
- Avoiding common pitfalls when using the ADX: Relying solely on the ADX can lead to suboptimal trading decisions. Be sure to use the ADX in conjunction with other technical indicators and fundamental analysis to develop a well-rounded trading strategy.
Limitations and Drawbacks of the Average Directional Index (ADX)
Despite its usefulness, the ADX has certain limitations and drawbacks that traders should be aware of:
- Performance in ranging or sideways markets: The ADX works best in trending markets. In ranging or sideways markets, the ADX may provide misleading signals or fail to identify significant trend changes.
- Sensitivity to price fluctuations: The ADX can be sensitive to price fluctuations, leading to occasional false signals. This can be especially problematic during periods of high market volatility.
- Overreliance on a single indicator: Relying exclusively on the ADX for trading decisions is not recommended. Traders should use a combination of technical indicators and incorporate fundamental analysis to create a well-rounded trading strategy.
- Inability to provide specific entry or exit points: The ADX helps identify trend strength and direction but does not provide specific entry or exit points. Traders need to use additional tools, such as price action analysis or other technical indicators, to determine optimal trade entry and exit levels.
Conclusion
The Average Directional Index (ADX) is a valuable tool for Forex traders looking to assess trend strength and direction. By understanding the intricacies of the ADX, incorporating it with other technical indicators, and following practical tips for its application, traders can enhance their trading strategy and improve their overall performance in the Forex market.