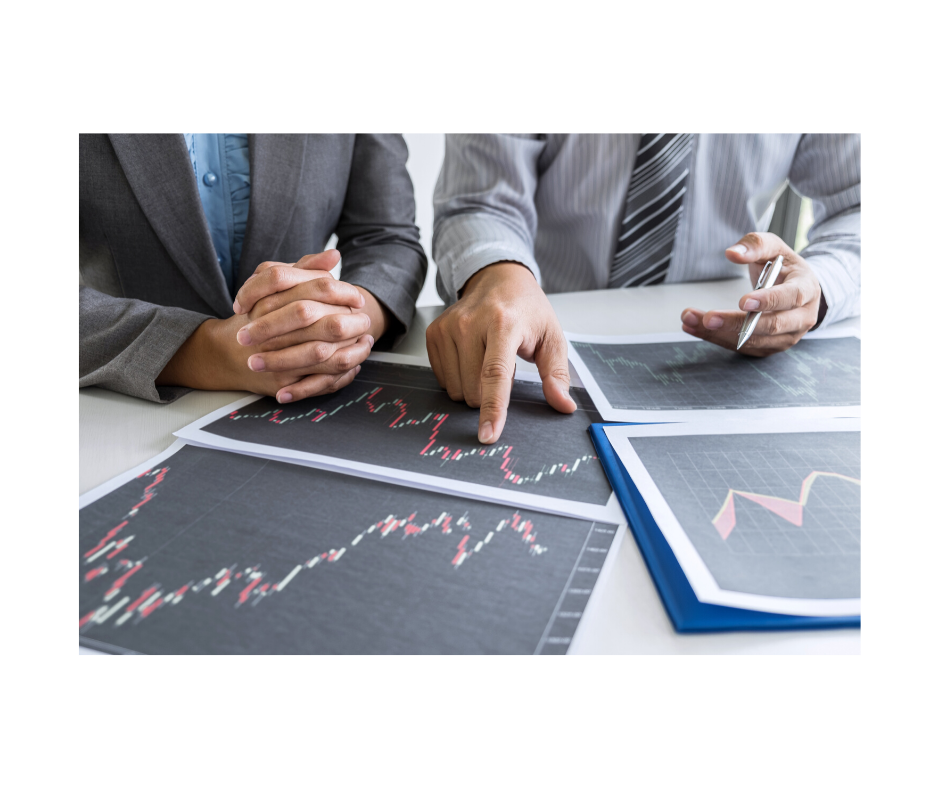

Like any other income-generating activity on earth, forex trading is not easy. The market changes every passing minute due to external factors, the actions of other traders, and the news. Any successful trader knows the importance of keeping up with economic news and political events. Learning how to trade on forex without indicators, also known as price action trading, can make your life a little easier in this field.
What is forex price action trading?
Price action is the same as trading on forex without indicators. It is a theory of market behavior that uses the psychology of market markers, traders, and the market itself. It tries to explain why the market is volatile without using indicators, news, or other external factors. Instead, it uses the charts of the currency pairs and their patterns. Price action traders, therefore, analyze charts to understand the market and to predict the future. Some also use the Price action – moving average tool to determine trends.
What are the pros of forex price action?
- As a trader, you will not need derivative indicators, expert advisors, or any other tools that usually come at a cost.
- It is easy to understand the basics and to analyze the state of any currency pairs of your choice without too much strain.
- It saves you the hassle of trusting indicators and other unreliable sources of information that may mess you up.
- In most cases, you trade with delayed orders, so there is absolutely no risk of slippage.
- You gain skills and knowledge that are useful in other security markets and stock exchanges when you use price action.
Limitations of price action trading
- Before using it, you need a deep understanding of how the market works.
- You do not have precise guidelines and instructions on when to enter or exit a trade.
- You are tasked with the responsibility of predicting what will happen in other participants in a trade with the hope that most of them are at least profitable traders.
- You must always use strategic think and understand situations before making any move. Emotions may ruin you. Since there are no rules, you have to use the universal guidelines and decide how you will follow them.
Must-know information before trading with price action alone.
Before you learn how to master price action, you need background information, and you must also have a few basic skills. These include the following;
Knowing how to read candlesticks
Candlesticks are the most crucial elements in a financial chart. Each candlestick comprises a body and a shadow. Shadows, also called wicks, will show you the maximum and minimum price during the period a candlestick exists. On the other hand, the body will give you the opening and closing price during the same period. The candlestick’s color shows you the direction the price has shifted.
Candlesticks have three moods, the first being bullish, which means that the candlesticks close above the opening price. The neutral mood means that the candlestick closes at almost the same price, while the bearish mood means it closes below the opening price. In the traditional charts, the bullish candlesticks are white, and the bearish are black, but more modern software may use different colors.
Japanese candlesticks
These are somewhat new to the western markets, and they replaced the traditional charts in the 1990s. They report the dynamics of the trends during a given time frame in addition to the opening and closing prices that charts provide. Here is how they work;
- The body gives you the asset price at the beginning and end of a given timeframe.
- The shadow display the maximum and minimum price during the period in which the candlestick exists.
- Colors show the direction of the price movement within a given timeframe. Green candles move up while red ones move down.
Candlestick patterns
Candlestick patterns offer the precision for real-time trading that chart patterns do not. They are a great way of trading without charts. Here are the different candlestick patterns and what they imply;
Internal/ inside bar
In case you have been asking yourself ”how to master pin bar strategy I will show you how it works and when its useful. You need first to know what it is and how its formed. This a large candlestick without any shadows whatsoever and is usually followed by a smaller opposite candlestick. i.e. the high is lower than the previous bar’s high, and the low is higher than the previous bar’s low as shown below.
The bigger one should be at least twice the size of the smaller one. To enter a trade in an internal bar, you ought to create a Pending order using the direction of the larger candlestick.


Pin bar Pattern
This is a candlestick with no body or has a very small one and a long shadow/tail on one side, and it often precedes a shift of trend. There should be some movement before a pin bar, but if the market is mainly flat, you can ignore the pin bar. The best point to enter the market is in the direction of the new trend, right behind the shorter arrow.

I would like to add that, many people make mistakes when trading this pin-bars but I want to show you how to trade them correctly today.
A trader need to ask themselves why these pinbars are there. usually, it means that, whichever the direction they were moving they got bounced back but closed either below the open or below the close
I want you to start thinking of how these pin bars will look in a timeframe deeper than what you are using to trade them for a better understanding.

What I wanted to know is that, you need always to know how that candle looks like in a lower timeframe for you to decide the direction.
Outside bar
This forms when a larger opposite candlestick follows a smaller one. To enter the market, you ought to set up a pending order in the direction of the smaller one.

Fake breakout
This happens when a candlestick breaks the level with its own shadow, but it closes in another direction. Do not enter the market at this point!
Double High/ Double Low (DHDL)
This forms when two candlesticks are unable to break through an arbitrary level, and the pattern only becomes viable in longer timeframes.

What is a Pending order?
An order in forex trading determines how much currency you are willing to sell or buy, and it can either be market or delayed. Usually, market orders are executed at the prevailing market price, and if this price changes between creation and processing, the order is processed at a new price. A pending order, therefore, refers to an order that is executed at a price that was previously determined but is ignored until the market price is the same. pending orders usually require much planning, but they also come with reduced inherent risk.
An example of a delayed order is when the market seems bullish, so you create a pending order that is above the local extremum to buy. In case the price shoots up, you will still purchase it but not make any loss. You will also not lose anything if the price falls.
NB: The extremum means the minimum or maximum value of the graph.
There are different types of delayed orders, which are;
- BuyStop: This is a delayed purchase order for a price that is higher than the current one.
- BuyLimit: This is a delayed purchase order for a price that is lower than the current one.
- SellStop: This is a delayed sale order for a price that is lower than the current one.
- SellLimit: This is a delayed sale order for a price that is higher than the current one.
- StopLoss: This allows you to set the limit on the order loss. If the loss surpasses a certain limit, the order closes automatically.
- TakeProfit: This allows you to set the limit on the order profits. If the profit reaches a certain limit, the order closes automatically.
How to Know when the market is intrending, channelling or ranging state?
Trend refers to the direction of the market movement within a given timeframe. It can either be ascending or descending.
- Ascending trend: This refers to a series of increasing maximums and minimums. If the price is below the previously recorded minimum, it signals that there will be a change of trend soon.
This is when the market is making new HHs or new LLs
- Descending: This refers to a series of decreasing maximums and minimums. If the price is above the previously recorded minimum, it signals an upcoming change to ascending.
This is formed when the market starts making LLs and LHs

What you need to know is that, regardless of the timeframe you are trading, when the previous LH was broken, that Is when trending state ( upward started) And when the previous HL as indicated in the chart, that is when the downtrending state started. You need to study this very carefully as it will give you some insights on when to know which is the market conditions you have.
For traders using MetaTrader 4, it is possible to mark all the minimums and maximums with rectangles on each chart.
When is the best moment to enter a trend?
This is during a correction, meaning a movement against the trend. You can also enter during a consolidation, which refers to a flat movement of the price. Entering a peak will reduce your profits. If you do not identify a trend clearly, it is best not to do anything and wait to see how the situation unfolds. This will shield you from losing your deposit.
You can determine a trend in the market, either using trendlines or moving averages. A moving average is a useful indicator that shows you the long-term activity on the market, and it shows its direction. Alternatively, you can use trend lines through the minimum and maximum values in the chart. Trend lines are not reliable, but they can help you to predict the market patterns.
What are best indicators for day trading?
Before starting any trading day, you need to follow some intraday tips. To maximize your profits, you need to understand the market, and this is something that I cannot overemphasize. Some of the best trading indicators that you can use to maximize your profits include;
- Moving Averages
- Bollinger Bands
- Momentum Oscillators
- Relative Strength Index (RSI)
- Support and resistance level
Resistance and support trading levels
A level refers to the zone where a trend changes and the collective consciousness of forex traders determines it. A support level is typically created under the pressure of the buying traders, and it shows you the minimum possible price of a specific currency pair. It acts as a floor in the market. Usually, the buying traders start buying at this level, causing the price to go up and reach the resistance level when they start selling.
The resistance level is formed under the pressure of the selling traders. It acts as the ceiling in the market, and it shows the maximum possible price of a particular currency pair. At this level, the selling traders begin by opening short positions, causing the price to fall to the support level, where they close positions. In a descending market, you can make money using short positions.
A trader should understand that, a resistance or support should NOT be a marked by a line but rather, it should be a zone. I am going to show you how to use those support and resistance lines today to improve your trading. I have illustrated using a chart for you to understand.

Trend breakout
This refers to two consecutive candlesticks that close outside the trend. After a trend breakout, the resistance level becomes the support level.
Fibonacci levels
These are levels based on the Golden Ratio. They form at 38.2%, 50%, 61.8%, and 78% of the previous market impulse. An impulse means the initial movement of the market, so it is a trend that is created when either the selling traders or the buying traders gain dominance in a market. The strength of each level is dependent on how many traders believe in it.
Chart patterns
Whether you are seeking information on trading without indicators Reddit or any other platform, you will realize that there are many chart patterns in forex trading. However, I will focus on the most important ones, that is the triangle and the flag. A triangle forms when the support and resistance lines cross, and there are four types of triangles;
- Ascending triangle: This one forms when the support line rises towards a stable resistance line, and it indicates an impending breakout.
- Descending triangle: It forms when the resistance line descends towards a stable support line, and it indicates that a breakout through the support line is imminent.
- Symmetrical triangle: It forms when both the resistance and support lines meet at a middle point, and it indicates a consolidation pending a breakout.
- A ranging triangle: It forms when the support and resistance lines move further away from each other, and it shows an increase in the instability and volatility of the market.
- On the other hand, a flag forms when the support and resistance lines are parallel to each other, and it can be ascending, descending, or rectangular. A rectangle flag signifies instability in the market.


How can I trade without indicators?
I cannot exhaust the information you should have before you master how to use the price action easy indicator in one article. However, you now have a few basics that will be helpful. You can proceed to the steps below to use the price action trading technique;
Step 1: Read the existing market conditions
Many traders cannot read the existing market conditions before making crucial decisions. Some do this out of ignorance, while others do it because of a lack of knowledge. Understanding the market conditions means analyzing a chart to determine the direction the wind is blowing. It is seemingly easy to do, but most traders forget its importance.
The market structure refers to technical analysis of the high and low points of price in a market that helps you to know the state of the market at a given time.
The results of the analysis offer you solid information about where the market is or is not moving to. You are then able to know if the market has a bullish, bearish, or an emerging trend. The market can also range between the two levels.
In trading without indicators PDF documents as well as other online sources, you will learn that the following terms are crucial;
Trending conditions
How can I trade intraday without indicators? You can do this by determining whether or not a market is trending. While there are numerous software to help you determine this, they are unnecessary. Typically, a trending market is one that makes higher highs and higher lows or one that is making lower highs and lower lows. Trending markets are idea for making money, but they can also burn you because they may be trading in the wrong direction. To prevent losses, you should wait for the prices to retrace into either swing lows or awing highs before joining the trend.
Ranging market structure
It is sometimes easy to determine ranging markets. Ranging conditions pose the challenge of being neutral such that anything goes, so they create an undesirable environment for trading. These markets are observed when the price is stuck between two major levels, that is, you will continuously see highs and lows appearing in the same horizontal levels.
Ranges are ordinarily turbulent and lack defined upper and lower limits, so you have to mark the swing points that occur in the same area. Due to the lack of defined boundaries for the top and bottom, it becomes hard to pinpoint reversal trades, so you must always be extra cautious when using ranging market structures.
Unreadable market structure
These are charts that are so crazy that it becomes hard to make sense out of them. This erratic behavior is often unexplained. If you cannot make sense of the situation, it is best not to join a trade.
Step 2: Establish the market rotations
After reading the chart, you should know the exact direction you want to be trading. Next, you should find the most likely place at which things will make a turn. When you establish this point, you need to use tools like horizontal levels, trend lines, Fibonacci levels, and pivot points to conduct technical analysis.
Markets will seldom move in a straight line, so the trend has to become your ally. Usually, the price moves in one direction almost half the time while it spends the other half rotating against the trend or in periods of consolidation. In a trending market, you will observe a move in the direction followed by short periods of counter rotations. The ultimate goal is to buy low and sell high, so being aware of these rotations will be very helpful.
Step 3: Determine the critical levels of support and resistance
These step helps you to determine the trading levels that will give you the most profits. Here, you need to use the “Keep It Simple” mantra. Focus on the key daily, weekly, and monthly lows and highs, which are easy to spot.
Step 4: Identify the low-risk trading opportunities with candlestick patterns
While it is difficult to weed out the most reliable candlestick patterns online, I can assure you that the engulfing and doji patterns are reliable. Other reliable ones are hammer or dragonfly dojis as they guide you on when to prey on pullbacks. When using candlestick patterns, remember to apply the following tips;
- Note the location as it is crucial. The setups are more likely to benefit you if they occur at key resistance or support zones.
- The market is always telling a story, and it is your duty as a trader to decipher it.
- Do not pay too much attention to individual candlesticks. Instead, focus on the clues that the price is leaving in the chart.
- The higher the timeframe you have, the stronger the signal is.
Learning how to trade on forex without indicators or price action trading is something that any trader can do. In this technique, you master how to analyze the market using candlestick patterns and price charts. Usually, this is not exclusive, but it can improve your trading system remarkably. Remember that price action trading is not foolproof, so you need to use other indicators for the best outcome.