
Introduction
The Relative Strength Index (RSI) is one of the most popular technical analysis indicators used by traders to determine overbought and oversold conditions in the market. Developed by J. Welles Wilder Jr. in the late 1970s, the RSI is a momentum oscillator that compares the magnitude of recent gains to recent losses in an attempt to determine whether a particular asset is oversold or overbought.
In this comprehensive guide, we will delve deep into the concept of RSI, how it works, and the various ways it can be used to make informed trading decisions.
What is RSI?
The Relative Strength Index( RSI) is a technical analysis indicator that measures the strength of an asset’s price action, usually on a scale of 0 to 100. It is a momentum oscillator that oscillates between 0 and 100, with values above 70 indicating that an asset is overbought and values below 30 indicating that it is oversold.
The formula for RSI is based on the average gain and loss over a specified time period, typically 14 days. The RSI is calculated as follows:
RSI = 100 – [100/(1 + RS)]
where RS is the average of the n-day up closes divided by the average of the n-day down closes.
How Does RSI Work?
The Relative Strength Index (RSI) is a technical analysis indicator that helps traders to measure the strength of an asset’s price action. It is a momentum oscillator that compares the magnitude of recent gains to recent losses in an attempt to determine whether a particular asset is overbought or oversold.
The RSI is a measure of the asset’s price momentum, typically on a scale of 0 to 100. An RSI value of above 70 is considered overbought, while an RSI value of below 30 is considered oversold.
The RSI is calculated using a mathematical formula that takes into account the asset’s average gain and loss over a specified period, typically 14 days. The RSI formula is:
RSI = 100 – [100/(1 + RS)]
Where RS is the average of the n-day up closes divided by the average of the n-day down closes.
To understand how RSI works, let’s take an example of a stock that is trading at $100 per share. The RSI is calculated over a 14-day period, and over the past 14 days, the stock has closed up for 8 days and down for 6 days. The average gain is therefore 8/14 or 57.14%, while the average loss is 6/14 or 42.86%.
To calculate the RSI, we need to first calculate the Relative Strength (RS). The formula for RS is:
RS = Average Gain / Average Loss
Using the example above, the RS would be:
RS = 57.14 / 42.86 = 1.33
The RSI is then calculated using the RS formula mentioned earlier:
RSI = 100 – [100/(1 + RS)]
RSI = 100 – [100/(1 + 1.33)]
RSI = 45.47
In this case, the RSI for the stock would be 45.47, which is below the 50 level, indicating that the stock is in a downtrend.
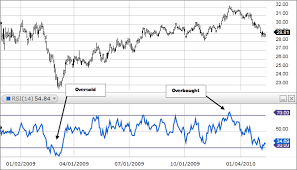
The Relative Strength Index (RSI) can be used in a number of ways to make informed trading decisions. One of the most common uses of the RSI is to identify overbought and oversold conditions in the market. When the RSI is above 70, it is considered overbought, and when it is below 30, it is considered oversold. Traders can use this information to make informed trading decisions. For example, when the RSI is above 70, it may be time to sell the asset, and when it is below 30, it may be time to buy.
Another way to use the Relative Strength Index is to look for divergence. Divergence occurs when the RSI and the price action of the asset are moving in opposite directions. For example, if the price of the asset is making a series of higher highs while the RSI is making a series of lower highs, it may indicate that the asset is losing momentum and that a reversal may be imminent.
Traders can also use moving averages in conjunction with the Relative Strength Index to make informed trading decisions. For example, if the price of an asset is above its 50-day moving average, and the RSI is above 50, it may indicate that the asset is in an uptrend and that it may be time to buy. Conversely, if the price of the asset is below its 50-day moving average, and the RSI is below 50, it may indicate that the asset is in a downtrend and that it may be time to sell.
How to Use Relative Strength Index
The RSI can be used in a variety of ways to make informed trading decisions. Some of the most common ways to use the RSI include:
-
Overbought and Oversold Conditions
The most common use of the Relative Strength Index is to identify overbought and oversold conditions in the market. When the RSI is above 70, it is considered overbought, and when it is below 30, it is considered oversold. Traders can use this information to make informed trading decisions. For example, when the RSI is above 70, it may be time to sell the asset, and when it is below 30, it may be time to buy.
-
Divergence
As mentioned earlier, divergence occurs when the Relative Strength Index and the price action of the asset are moving in opposite directions. Divergence can be a powerful tool for traders to identify potential trend reversals. When the RSI is making a series of higher lows while the price action is making a series of lower lows, it may indicate that a bullish reversal is imminent. Conversely, when the RSI is making a series of lower highs while the price action is making a series of higher highs, it may indicate that a bearish reversal is imminent.
-
Trend Confirmation
The RSI can also be used to confirm trends. When the price of an asset is trending higher, the RSI will typically remain above 50, and when the price is trending lower, the RSI will typically remain below 50. Traders can use this information to confirm trends and make informed trading decisions.
-
Overlapping Timeframes
Another way to use the Relative Strength Index is to look for overbought and oversold conditions on overlapping timeframes. For example, if the RSI on the daily chart is above 70, but the RSI on the 4-hour chart is below 30, it may indicate that a trend reversal is imminent.
-
Moving Averages
Traders can also use moving averages in conjunction with the RSI to make informed trading decisions. For example, if the price of an asset is above its 50-day moving average, and the RSI is above 50, it may indicate that the asset is in an uptrend and that it may be time to buy. Conversely, if the price of the asset is below its 50-day moving average, and the RSI is below 50, it may indicate that the asset is in a downtrend and that it may be time to sell.
Conclusion
In conclusion, the Relative Strength Index (RSI) is a popular technical analysis indicator used by traders to determine overbought and oversold conditions in the market. The RSI can be used in a variety of ways to make informed trading decisions, including identifying overbought and oversold conditions, divergence, trend confirmation, overlapping timeframes, and moving averages.
As with any trading indicator, the Relative Strength Index should be used in conjunction with other indicators and technical analysis tools to make informed trading decisions. Traders should also be aware of the limitations of the RSI, including false signals and the potential for the RSI to remain in overbought or oversold conditions for extended periods.
Overall, the RSI is a powerful tool for traders to add to their technical analysis toolkit, and with proper usage, it can help traders maximize their trading profits.