Introduction
Welcome to the world of swing trading strategies, where traders aim to capture short to medium-term price movements for profitable trades. In this comprehensive guide, we will delve into various swing trading strategies and techniques that can help you achieve consistent profitability in the stock market. Whether you are a beginner or an experienced trader, understanding and implementing these strategies can enhance your trading skills and boost your success rate.
Basic Principles of Swing Trading
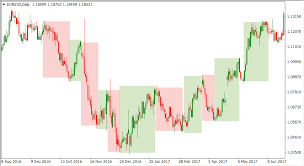
Swing trading involves profiting from price swings within an established trend. Unlike day trading, swing traders hold their positions for a few days to weeks, capitalizing on short-term market fluctuations. To become a successful swing trader, it is essential to grasp the basic principles of this trading style. This section will cover the importance of recognizing price swings, understanding timeframes, and determining optimal holding periods in swing trading.
Technical Analysis for Swing Trading
When it comes to implementing profitable swing trading strategies, technical analysis plays a crucial role. By utilizing various tools and indicators, swing traders can make informed decisions based on historical price data and chart patterns. In this section, we will explore the significance of technical analysis and how it contributes to successful swing trading.
Understanding Key Technical Analysis Tools
Technical analysis relies on a range of tools to interpret price movements and identify potential entry and exit points. These tools are vital components of swing trading strategies, including “swing trading strategies” itself. Here are some key technical analysis tools used by swing traders:
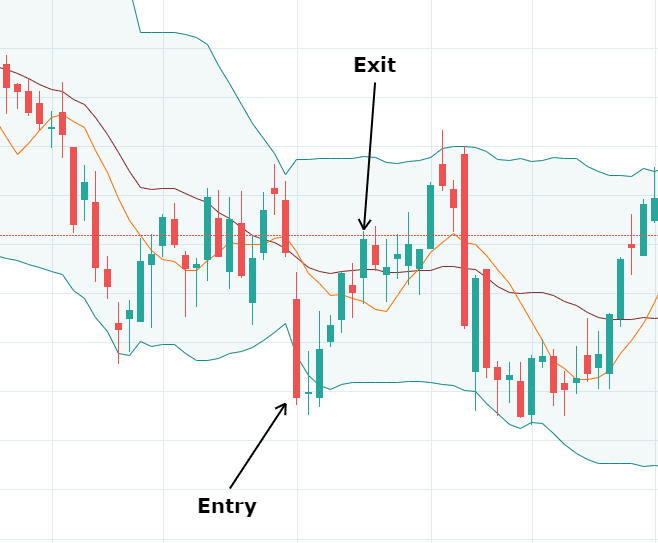
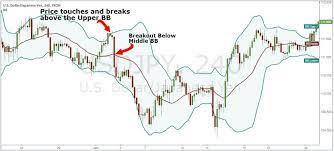
1. Support and Resistance Levels: Support levels act as price floors, indicating areas where buying pressure surpasses selling pressure. Resistance levels, on the other hand, act as price ceilings where selling pressure outweighs buying pressure. Identifying these levels is crucial in determining optimal entry and exit points in swing trading strategies.
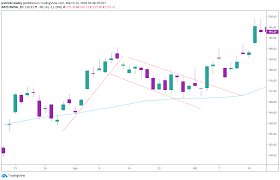
2. Trendlines: Trendlines are drawn to connect higher lows in an uptrend or lower highs in a downtrend. These lines provide a visual representation of the prevailing trend and can signal potential trend reversals if breached. Understanding trendlines is essential for successful swing trading strategies.
3. Moving Averages: Moving averages smooth out price data, offering traders a clearer view of the underlying trend. In swing trading, the 50-day and 200-day moving averages are commonly used. Traders look for bullish crossovers (shorter-term moving average crossing above longer-term moving average) as potential buy signals and bearish crossovers (shorter-term moving average crossing below longer-term moving average) as potential sell signals.
4. Chart Patterns: Chart patterns, such as double tops, double bottoms, triangles, and head and shoulders patterns, provide valuable insights into potential trend reversals or continuation. These patterns are formed by price movements and serve as important indicators for swing traders.
Utilizing Technical Analysis for Swing Trading Strategies
Technical analysis is instrumental in identifying swing trading opportunities and determining optimal entry and exit points. Here’s how swing traders employ technical analysis:
1. Trend Identification: Traders use technical analysis to identify the prevailing trend, be it an uptrend, downtrend, or sideways market. Aligning trades with the overall trend enhances the probability of success in swing trading strategies.
2. Entry and Exit Points: Technical analysis tools, such as support and resistance levels, trendlines, and chart patterns, assist swing traders in pinpointing ideal entry and exit points. For example, traders may look for pullbacks to significant support levels in uptrends as potential entry points. Conversely, a break below a key support level might indicate an exit signal.
3. Confirmation of Reversals: Technical analysis helps confirm potential trend reversals. For instance, if a stock price forms a double top pattern and breaks below the neckline, it may suggest a bearish reversal. Swing traders can use this information to enter short positions.
4. Risk Management: Technical analysis aids in setting appropriate stop-loss levels to manage risk. By placing stop-loss orders below support levels or above resistance levels, traders can limit potential losses if the trade doesn’t go as planned.
Continuous Analysis and Adaptation
It’s important to note that technical analysis is not a static approach. Markets are dynamic, and swing traders must adapt their strategies and analysis techniques accordingly. Regularly reviewing and adjusting technical analysis tools and strategies based on changing market conditions is crucial for long-term success.
Momentum Indicators for Swing Trading
Momentum indicators play a crucial role in swing trading strategies as they help confirm price movements and identify overbought or oversold conditions. By analyzing the speed and strength of price changes, these indicators provide valuable insights into the market’s momentum, which can guide traders in making informed trading decisions. Let’s explore some popular momentum indicators used in swing trading and how they can enhance your trading strategy.
Relative Strength Index (RSI)
The Relative Strength Index (RSI) is a widely used momentum indicator in swing trading. It measures the magnitude of recent price changes to determine whether a stock is overbought or oversold. Ranging from 0 to 100, the RSI value above 70 suggests overbought conditions, indicating a potential reversal or pullback, while a value below 30 indicates oversold conditions, signaling a possible upward price movement.
When incorporating the RSI into swing trading strategies, traders often look for divergence between the indicator and the price chart. For example, if the price is making higher highs while the RSI is making lower highs, it may indicate a weakening trend and a potential reversal. This divergence can help traders identify entry and exit points for their swing trades.
Moving Average Convergence Divergence (MACD)
The Moving Average Convergence Divergence (MACD) is another popular momentum indicator used by swing traders. It consists of two lines: the MACD line and the signal line. The MACD line is calculated by subtracting the 26-day exponential moving average (EMA) from the 12-day EMA, while the signal line is a 9-day EMA of the MACD line.
Traders often look for the MACD line to cross above the signal line as a bullish signal and below the signal line as a bearish signal. This crossover indicates a potential change in the momentum of the stock, providing an opportunity for swing traders to enter or exit their positions.
In addition to crossovers, swing traders also pay attention to the divergence between the MACD line and the price chart. Similar to the RSI, if the price is making higher highs while the MACD line is making lower highs, it could signal a potential reversal or pullback.
Stochastic Oscillator
The Stochastic Oscillator is a momentum indicator that compares the closing price of a stock to its price range over a specified period. It consists of two lines: the %K line and the %D line. The %K line represents the current closing price relative to the price range, while the %D line is a moving average of the %K line.
The Stochastic Oscillator oscillates between 0 and 100, with readings above 80 considered overbought and readings below 20 considered oversold. Swing traders often look for %K line crossovers or bullish/bearish divergences to identify potential entry or exit points.
Incorporating Momentum Indicators into Swing Trading Strategies
Now that we have discussed some popular momentum indicators, let’s see how they can be incorporated into swing trading strategies. One approach is to use these indicators as a confirmation tool alongside other technical analysis tools.
For example, suppose you identify a potential swing trade based on a breakout from a chart pattern or a support/resistance level. To strengthen your conviction, you can look for confirmation from momentum indicators such as RSI, MACD, or Stochastic Oscillator. If these indicators align with your analysis and show overbought or oversold conditions, it can enhance the probability of a successful trade.
Breakout Strategies
Breakout strategies involve identifying and capitalizing on price breakouts from consolidation or chart patterns. This section will explore different types of breakout patterns, including breakouts from price channels, triangles, and rectangles. We will discuss how to set entry and exit points, manage risk, and maximize profit potential in breakout trading.
Pullback Strategies
Pullback strategies aim to take advantage of temporary price retracements within an established trend. By identifying key support or resistance levels and utilizing tools like Fibonacci retracements, swing traders can pinpoint potential entry opportunities. This section will provide insights into spotting pullback setups, setting appropriate entry and exit points, and managing risk effectively.
Swing Trading with Candlestick Patterns
Candlestick patterns are powerful tools in swing trading strategies as they provide valuable insights into market sentiment and potential trend reversals. By understanding and effectively utilizing candlestick patterns, swing traders can improve their timing of trades and increase the probability of profitable outcomes. In this section, we will explore swing trading with candlestick patterns, focusing on essential patterns, their interpretation, and their significance in swing trading strategies.
Understanding Candlestick Patterns
Candlestick patterns are formed by the open, high, low, and close prices of a trading period and are visual representations of price action. These patterns can indicate the balance between buyers and sellers, bullish or bearish sentiment, and potential trend reversals. Before diving into specific candlestick patterns, it’s crucial to understand the basic components of a candlestick, including the body, upper shadow, and lower shadow.
Essential Candlestick Patterns for Swing Trading
- Engulfing Patterns: Engulfing patterns occur when a candlestick completely engulfs the previous candlestick. A bullish engulfing pattern suggests a potential reversal from a downtrend to an uptrend, while a bearish engulfing pattern indicates a potential reversal from an uptrend to a downtrend. These patterns signal strong momentum and can be used to identify potential entry and exit points in swing trading strategies.
- Doji: Doji candlesticks have very small bodies, indicating a state of indecision in the market. They occur when the open and close prices are nearly the same. A doji can signify a potential trend reversal or a continuation depending on its location within the price action. Swing traders often use doji patterns as a signal to exercise caution and wait for confirmation before entering or exiting a trade.
- Hammers and Shooting Stars: Hammers and shooting stars are candlestick patterns with a small body and a long lower or upper shadow, respectively. A hammer occurs at the bottom of a downtrend and suggests a potential bullish reversal, while a shooting star appears at the top of an uptrend and signals a potential bearish reversal. These patterns indicate a rejection of lower or higher prices, respectively, and can be valuable in timing swing trades.
- Morning and Evening Stars: Morning and evening star patterns consist of three candlesticks and indicate potential trend reversals. The morning star pattern appears during a downtrend and consists of a long bearish candle, followed by a small-bodied candle (doji or spinning top), and a long bullish candle. Conversely, the evening star pattern occurs during an uptrend and consists of a long bullish candle, followed by a small-bodied candle, and a long bearish candle. These patterns suggest a shift in market sentiment and can be used as entry or exit signals in swing trading strategies.
Applying Candlestick Patterns in Swing Trading Strategies
- Confirmation with Other Indicators: While candlestick patterns can provide valuable insights, it’s important to confirm their signals with other technical indicators. Combine candlestick patterns with trendlines, support and resistance levels, and momentum indicators to strengthen the validity of your swing trading setups.
- Identifying Entry and Exit Points: Candlestick patterns can help identify potential entry and exit points for swing trades. For example, a bullish engulfing pattern at a key support level may serve as a potential entry signal, while a bearish engulfing pattern near a resistance level could indicate a potential exit signal. Use these patterns in conjunction with other technical analysis tools to determine optimal entry and exit levels.
- Managing Risk: Proper risk management is crucial in swing trading. Set stop-loss orders below support levels for long trades and above resistance levels for short trades to limit potential losses. Additionally, consider trailing stops to protect profits as the trade moves in your favor.
Risk Management in Swing Trading
Risk management is an integral part of any successful trading strategy, including swing trading strategies. In this guide, we will explore the significance of risk management in swing trading and how it can help safeguard your profits. By incorporating effective risk management techniques into your swing trading strategies, you can minimize potential losses and enhance your overall trading performance.
Understanding Risk in Swing Trading
To fully comprehend the importance of risk management in swing trading strategies, it’s crucial to acknowledge the inherent risks involved. Swing trading aims to capitalize on short to medium-term price movements, which inherently carry a level of uncertainty. Market volatility, unexpected news events, and sudden price reversals are all factors that can impact swing trades. Recognizing and accepting these risks is the first step in implementing effective risk management.
Setting Stop-Loss Orders
One of the primary tools for managing risk in swing trading strategies is the use of stop-loss orders. A stop-loss order is a predetermined price level at which you exit a trade to limit potential losses. By setting a stop-loss order, you define the maximum amount of capital you are willing to risk on a trade. It’s crucial to determine an appropriate stop-loss level based on your risk tolerance and the characteristics of the trade setup. Implementing stop-loss orders is a key component of protecting your investments in swing trading strategies.
Determining Position Sizes
Proper position sizing is essential for managing risk in swing trading. It involves determining the number of shares or contracts to trade based on the size of your trading account and the level of risk you are willing to take. Position sizing ensures that each trade’s potential loss is within your predetermined risk tolerance. By carefully calculating position sizes, you can control the amount of capital at risk and maintain consistency in your swing trading approach. This is a fundamental aspect of risk management in swing trading strategies.
Using Risk-Reward Ratios
Risk-reward ratios play a crucial role in managing risk and maximizing profitability in swing trading strategies. A risk-reward ratio compares the potential profit of a trade to its potential loss. It helps you assess whether a trade is worth taking based on the potential return relative to the risk involved. Favorable risk-reward ratios ensure that potential profits outweigh potential losses, making the trade more appealing. By selectively choosing trades with positive risk-reward ratios, you can improve your overall profitability in swing trading strategies.
Maintaining Discipline and Emotion Control
Maintaining discipline and emotional control is vital for effective risk management in swing trading strategies. Emotions such as greed and fear can lead to impulsive actions that deviate from your risk management plan. It’s crucial to stick to your predetermined risk management strategies, follow your trading plan, adhere to stop-loss orders, and avoid emotional trading based on short-term market fluctuations. By staying disciplined, you can make rational decisions based on your swing trading strategy, enhancing risk management.
Continuous Monitoring and Adjustments
Risk management in swing trading is an ongoing process that requires continuous monitoring and adjustments. Market conditions can change rapidly, and it’s important to regularly review and adjust your risk management strategies accordingly. This includes revisiting and updating your stop-loss levels, position sizes, and risk-reward ratios based on market volatility and trade performance. By staying proactive and adapting to evolving market conditions, you can optimize your risk management approach and increase the effectiveness of your swing trading strategies.
Building a Swing Trading Strategy
A successful swing trading strategy is built upon a strong foundation of analysis, risk management, and adaptability. By developing a well-defined plan and incorporating effective swing trading strategies, traders can increase their chances of achieving consistent profitability in the stock market. In this section, we will explore the key components of building a swing trading strategy and how to optimize its performance.
1. Define Your Trading Goals
Before diving into the specifics of swing trading strategies, it is essential to clarify your trading goals. Are you looking for short-term gains or long-term wealth accumulation? What level of risk are you comfortable with? Defining your objectives will help shape the structure and parameters of your swing trading strategy.
2. Conduct Technical Analysis
Technical analysis plays a crucial role in swing trading strategies as it helps identify potential entry and exit points. Utilize various technical analysis tools such as support and resistance levels, trendlines, and chart patterns to analyze price action. By understanding market trends, you can make informed decisions and increase the probability of successful trades.
3. Identify Swing Trading Setups
Swing trading setups are specific patterns or conditions in the market that indicate potential trading opportunities. These setups can include chart patterns, breakouts, pullbacks, or even fundamental catalysts. As a swing trader, your goal is to identify these setups and develop a strategy to take advantage of them.
4. Set Entry and Exit Points
Determining precise entry and exit points is critical in swing trading strategies. Look for areas of support or resistance where price is likely to reverse or break out. Utilize tools like moving averages, oscillators, or candlestick patterns to confirm your entry and exit decisions. Setting appropriate stop-loss orders and profit targets is vital for managing risk and protecting your capital.
5. Implement Risk Management Techniques
Risk management is a fundamental aspect of any trading strategy. As a swing trader, you need to define your risk tolerance and implement risk management techniques accordingly. This can include position sizing, setting stop-loss orders, and adhering to predetermined risk-reward ratios. By effectively managing risk, you can preserve capital during losing trades and maximize profitability during winning trades.
6. Backtest and Refine Your Strategy
Once you have defined your swing trading strategy, it is crucial to backtest it using historical data. Backtesting allows you to evaluate the performance of your strategy and identify areas for improvement. Analyze the results, make necessary adjustments, and refine your strategy accordingly. This iterative process ensures that your strategy remains adaptable and effective in different market conditions.
7. Monitor and Adapt to Market Conditions
Market conditions are constantly changing, and as a swing trader, you need to be aware of these shifts. Stay updated with market news, economic events, and industry trends that may impact your trades. Continuously monitor the performance of your strategy and be willing to adapt or tweak it when necessary. Flexibility and adaptability are key to long-term success in swing trading.
8. Practice Patience and Discipline
Patience and discipline are crucial virtues for swing traders. Not every trade will be profitable, and there will be periods of drawdowns. Stick to your trading plan, avoid emotional decision-making, and maintain discipline even during challenging times. Successful swing trading requires consistency and a long-term perspective.
Conclusion
Mastering swing trading strategies is a key step toward achieving profitability in the stock market. By understanding and implementing the techniques discussed in this guide, you can enhance your trading skills and improve your success rate. Remember to practice disciplined risk management, adapt your strategies to evolving market conditions, and stay committed to continuous learning. Start applying these swing trading strategies today and embark on a path to consistent profitability.