Double Bollinger Band Strategy: A Comprehensive Trading Guide for Enthusiasts

Double Bollinger Band Strategy

Introduction

In the vast world of technical analysis, the Double Bollinger Band Strategy stands out as a versatile tool, enabling traders to better decipher market conditions. Its significance in the contemporary trading arena is unmatched, offering valuable insights into potential entry and exit points.

Understanding Bollinger Bands

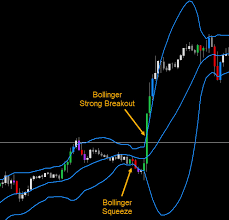
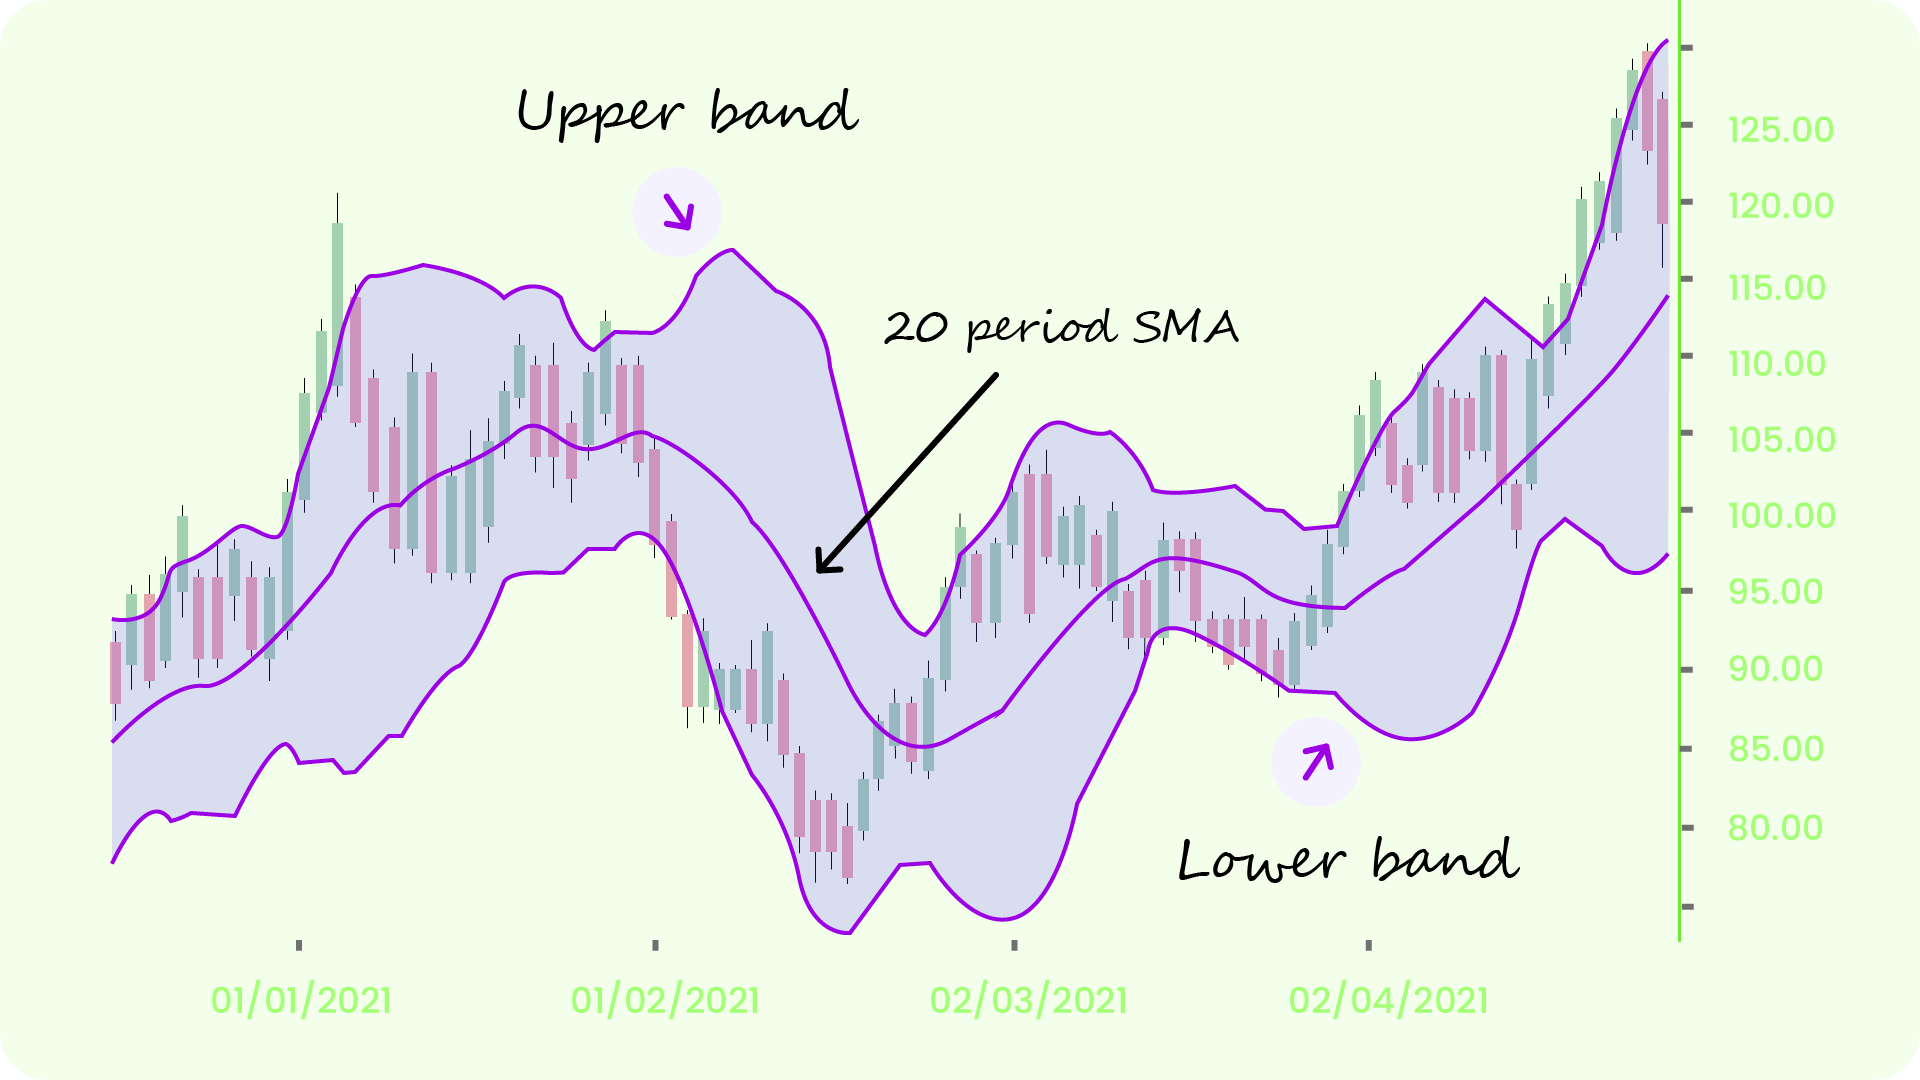
Before diving deep into the double strategy, let’s lay a foundation by understanding the basics of Bollinger Bands. They are a set of volatility bands placed above and below a moving average. While John Bollinger, the man behind this technique, designed these bands in the 1980s, their relevance remains potent even today. The bands consist of three main components: the middle, upper, and lower bands, effectively encapsulating price movements.

Delving into Double Bollinger Bands

What elevates the Double Bollinger Band Strategy above its single counterpart? Essentially, it’s the addition of another set of bands. These bands, while rooted in the same principle, offer an enhanced lens through which traders can view market volatility and price action. To implement this on a chart, traders typically deploy two sets of Bollinger Bands, one with a standard deviation of 1 and another with a standard deviation of 2.

How the Double Bollinger Band Strategy Works

At its core, the Double Bollinger Band Strategy is designed to provide traders with a more detailed and expansive view of market volatility and potential price direction. By using two sets of Bollinger Bands, traders can determine and validate potential trade signals with increased accuracy. Let’s delve deeper into how the double bollinger band strategy functions, offering a unique advantage in the world of technical analysis.

Foundational Understanding

To appreciate the double bollinger band strategy, it’s essential to first grasp the basics of a single Bollinger Band. A typical Bollinger Band consists of a middle band being a simple moving average, and two outer bands that represent standard deviations away from this middle band. When prices fluctuate, the bands expand and contract, giving a visual representation of market volatility.

Implementing the Double Bands

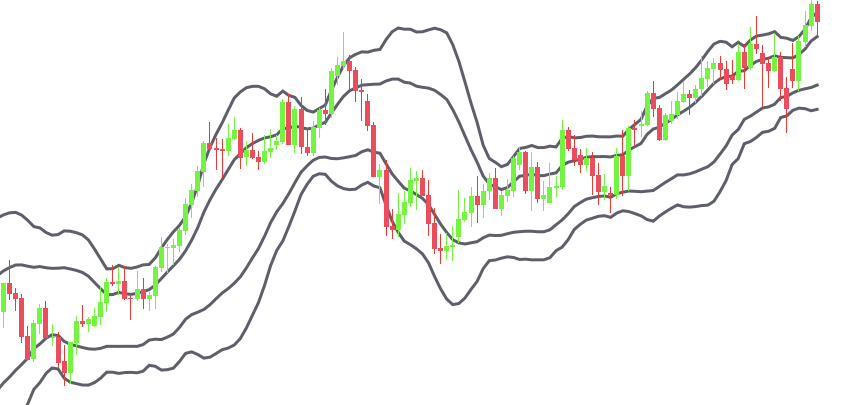
The double bollinger band strategy essentially incorporates two distinct sets of Bollinger Bands. The first set uses a standard deviation of 1, while the second set uses a standard deviation of 2. This creates a multi-layered indicator where you have a total of five lines: two outer bands, two inner bands, and the middle simple moving average.

Identifying Trade Signals

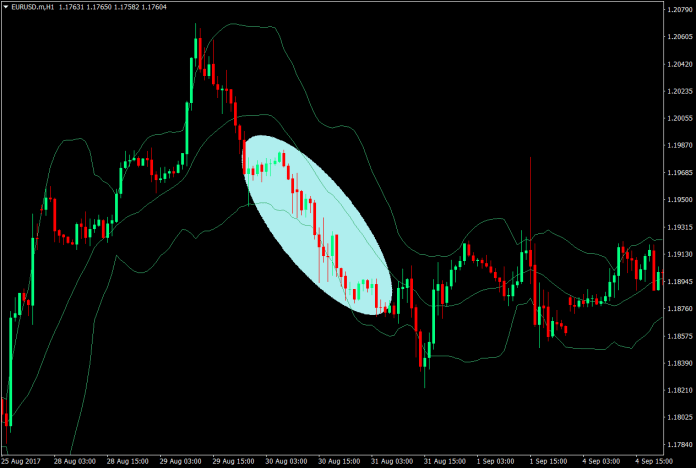
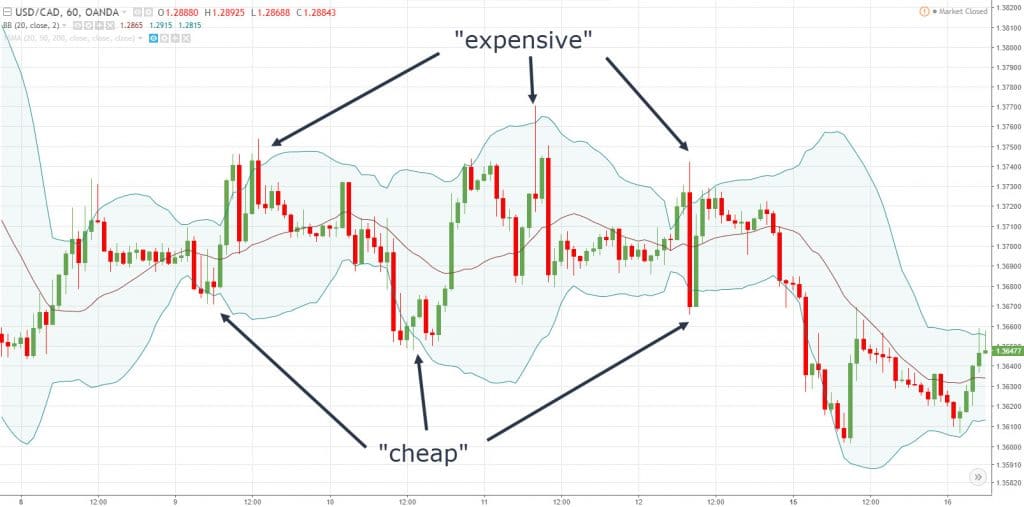
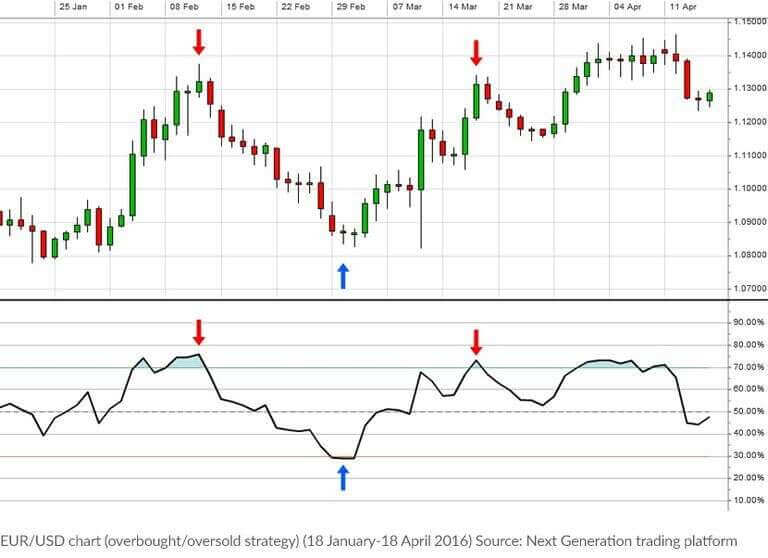
When utilizing the double bollinger band strategy, the outer bands – those linked with a standard deviation of 2 – act as territories that determine potential overbought or oversold market conditions. If the price touches or crosses these outer bands, it could be an indication that the market is reaching an extreme, and a reversal could be imminent.

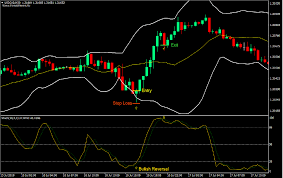
On the other hand, the inner bands – associated with a standard deviation of 1 – play a crucial role in confirming potential trading signals. For example, if a price was to touch the outer upper band (indicating a potential overbought condition) and then recedes to interact with the inner upper band, this could be interpreted as a confirmation of a bearish reversal. Similarly, when prices touch the outer lower band and then rise to engage with the inner lower band, it could indicate a bullish reversal.

Maximizing the Strategy

One of the primary benefits of the double bollinger band strategy is its ability to reduce the risk of false signals. By providing an additional layer of validation, traders can make more informed decisions. For instance, if a trader is unsure about a potential bullish signal upon the price touching the outer lower band, they can wait for further confirmation when the price interacts with the inner band. This double-checking mechanism enhances the accuracy of trade entries and exits.

Fine-tuning the Approach

While the double bollinger band strategy is highly effective, traders might occasionally need to adjust the settings to better align with specific market conditions or assets they are trading. The beauty of this strategy is its adaptability. Traders can modify the period of the simple moving average or even the standard deviations based on their trading preferences, ensuring that the strategy remains relevant and effective across different scenarios.

Benefits of Using Double Bollinger Bands

The world of trading is replete with numerous techniques and strategies to help investors make informed decisions. One of the most formidable tools that have gained significant traction among traders is the double Bollinger band strategy. This strategy, which utilizes two sets of Bollinger bands with different standard deviations, offers a plethora of advantages. Let’s delve deeper into the multiple benefits of incorporating the double Bollinger band strategy into your trading routine.

  1. Enhanced Accuracy in Market Analysis The primary allure of the double Bollinger band strategy is its heightened accuracy. By having two sets of bands – one with a standard deviation of 1 and the other with a standard deviation of 2 – traders can achieve a more nuanced understanding of the market. The overlap and interaction between these bands provide a clearer picture of potential price movements and trend strengths.
  2. Improved Signal Confirmation With the double Bollinger band strategy, traders have an additional layer for confirming potential trade signals. When prices touch the outer bands, the inner bands serve as a zone of confirmation. If prices move into this inner zone following an interaction with the outer bands, it often signifies a robust continuation of the prevailing trend, giving traders an added assurance before making a trade decision.
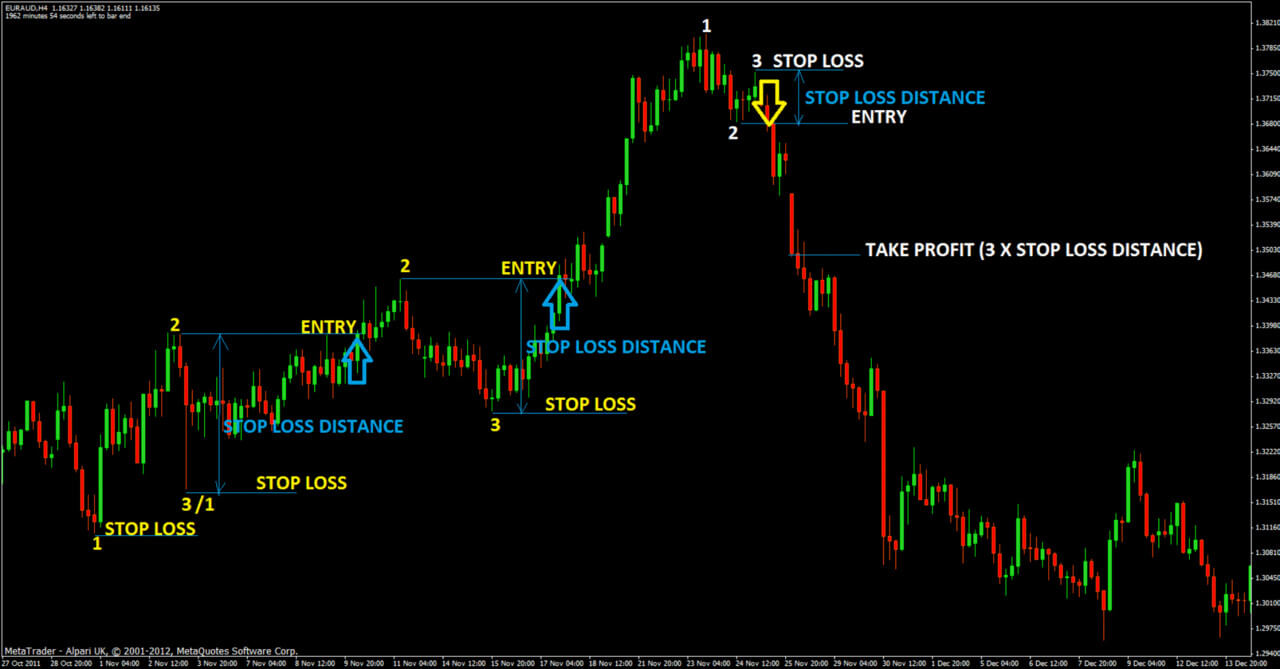
  3. Better Risk Management Incorporating the double Bollinger band strategy aids in superior risk management. By using both sets of bands, traders can set more accurate stop-loss and take-profit points. The bands essentially act as dynamic support and resistance levels, enabling traders to adjust their positions based on the evolving market conditions and thus minimize potential losses.
  4. Versatility Across Different Market Conditions One of the standout features of the double Bollinger band strategy is its versatility. Whether the market is trending or range-bound, this strategy offers valuable insights. In a trending market, the bands help in identifying the strength and direction of the trend, while in a sideways market, the interaction of prices with the bands can highlight potential breakout or breakdown points.
  5. Applicability Across Multiple Timeframes Whether you’re a day trader, swing trader, or a long-term investor, the double Bollinger band strategy is adaptable across various timeframes. This flexibility ensures that traders of all styles can harness the power of this strategy, tailoring it to their specific needs and trading goals.
  6. Reduced Likelihood of False Signals In the trading realm, false signals are a constant challenge. However, the double Bollinger band strategy, with its dual-layer of bands, significantly diminishes the chances of these misleading indications. By waiting for confirmations from the inner bands after price interactions with the outer bands, traders can filter out many of the false alarms that might lead to unprofitable trades.

Potential Pitfalls and How to Avoid Them

1. Over-reliance on the Indicator:

One of the most common missteps when using the Double Bollinger Band Strategy is placing undue trust in the bands alone. Traders sometimes assume that when the price touches or crosses a band, it’s an automatic signal for entry or exit. However, this strategy, like all technical indicators, should not be used in isolation.

Solution: Diversify your analysis. While the Double Bollinger Band Strategy is powerful, integrate it with other technical and fundamental indicators. Combining tools can offer a broader market perspective and reduce dependency on a single signal source.

2. Misinterpreting Volatility:

The Double Bollinger Band Strategy thrives on gauging volatility. However, heightened market volatility can sometimes produce erratic price movements that touch the outer bands frequently. These rapid movements can be mistaken for genuine trading signals.

Solution: Look for confirmations. If the market is particularly volatile, wait for the price to stabilize within the inner bands of the Double Bollinger Band Strategy before considering any trading decision. This patience can help filter out noise and improve trade accuracy.

3. Ignoring the Broader Trend:

In their pursuit of capturing short-term price movements, traders can sometimes neglect the overarching trend. For instance, while the Double Bollinger Band Strategy might suggest a temporary bullish move, the broader market could be in a prolonged bearish phase.

Solution: Always align the Double Bollinger Band Strategy with the bigger market picture. Before executing trades, step back and assess the macro trend. This ensures that you’re not trading counter to a dominant movement.

4. Lack of Flexibility:

Sticking rigidly to pre-defined settings in the Double Bollinger Band Strategy can occasionally backfire. Markets are dynamic, and what works under one set of conditions might falter under another.

Solution: Periodically review and adjust the standard deviation settings of your Double Bollinger Bands. By fine-tuning the strategy based on prevailing market conditions, you increase its effectiveness and adaptability.

5. Overtrading:

The granularity of insights provided by the Double Bollinger Band Strategy can sometimes spur traders to make more trades than necessary, thinking they’re capitalizing on every possible move.

Solution: Remember that quality trumps quantity. Rather than trying to catch every price movement suggested by the Double Bollinger Band Strategy, focus on more pronounced and confirmed signals. This reduces the risk of being caught in minor price fluctuations that lack substantial follow-through.

Steps to Implement the Double Bollinger Band Strategy

1. Choose Your Time Frame

Whether you’re a scalper, day trader, or a swing trader, the first step is to select the time frame that fits your trading style. The double Bollinger band strategy can be applied across various time frames, from the 1-minute chart up to the weekly. Your choice of time frame will influence the subsequent steps and the nature of the signals you’ll receive.

2. Setting Up Your Charting Tool

Once your time frame is set, it’s time to configure your charting software. Most modern charting platforms offer the Bollinger band indicator. For the double Bollinger band strategy, you’ll need to set up two sets of bands:

  • The first set will have a period of 20 (default setting) with a standard deviation of 1. This represents the inner band.
  • The second set, the outer band, will also have a period of 20 but with a standard deviation of 2.

Ensure both sets are visible and differentiated, perhaps by using contrasting colors.

3. Understanding the Signals

With your chart ready, familiarize yourself with the signals offered by the double Bollinger band strategy. Essentially:

  • Prices touching the outer bands signify overbought (upper band) or oversold (lower band) conditions.
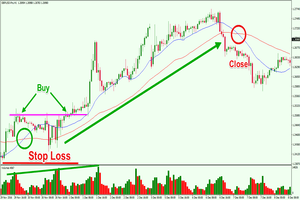
  • A move from the outer to the inner band usually suggests a potential trend continuation.

4. Wait for Confirmations

The strength of the double Bollinger band strategy lies in its confirmations. Once the price touches an outer band, you should patiently wait for it to move towards the inner band. This movement often confirms the strength of the prevailing trend, be it bullish or bearish.

5. Combine with Other Indicators (Optional)

While the double Bollinger band strategy is powerful on its own, some traders opt to combine it with other technical indicators for added assurance. Common choices include the Relative Strength Index (RSI) or Moving Average Convergence Divergence (MACD). These can provide supplementary signals that align with the double Bollinger band strategy’s readings.

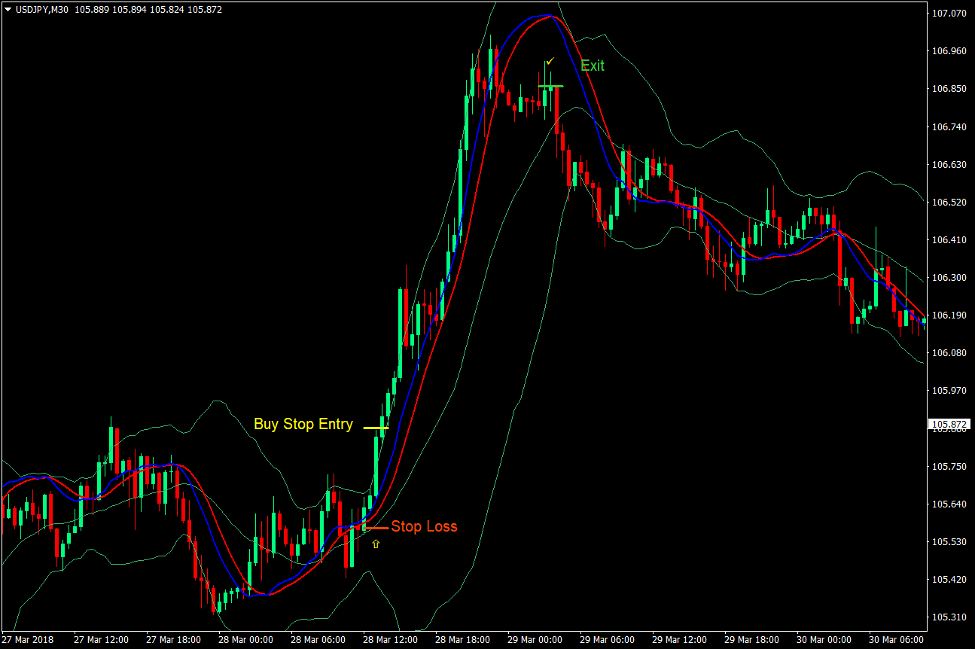
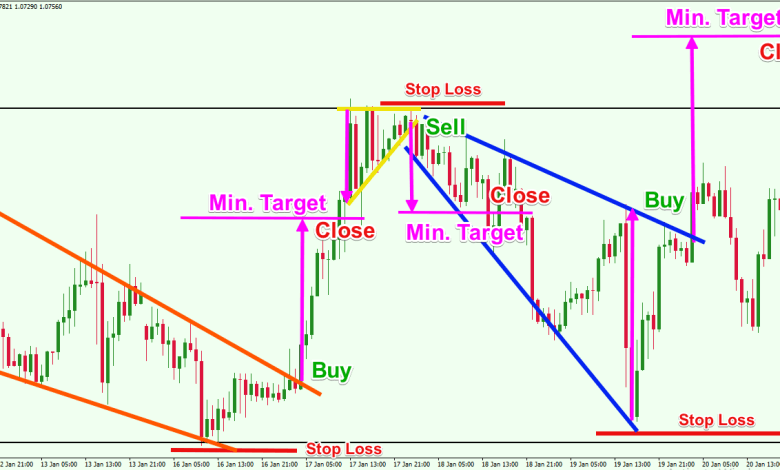
6. Entry and Exit Points

Once all conditions align:

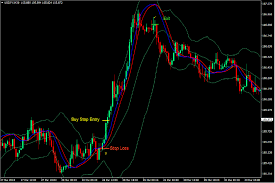
  • For a bullish trend: Consider entering a buy trade when the price, after touching the lower outer band, moves up to the lower inner band.
  • For a bearish trend: Consider a sell entry when the price, after touching the upper outer band, drifts down to the upper inner band.

Your exit points should be determined based on your risk tolerance and trading goals. Some traders opt to exit once the price touches the opposite inner band, while others might wait for further confirmation.

7. Review and Adjust

The forex market is dynamic. Regularly review how the double Bollinger band strategy is serving you. Maybe certain currency pairs offer clearer signals, or perhaps specific time frames align better with your trading style. Stay flexible and adjust as needed.

Optimizing the Double Bollinger Band Strategy

The double Bollinger band strategy, by its very design, provides traders with a sophisticated tool to interpret price movements and volatility. Yet, as with all strategies, periodic optimization ensures that it remains in sync with the ever-evolving market dynamics. But how does one refine and adjust the double Bollinger band strategy to continue reaping its benefits? Let’s delve into that.

Understanding the Basics

The foundation of the double Bollinger band strategy lies in its two sets of Bollinger Bands, with different standard deviations, namely 1 and 2. These bands map out four crucial zones in the market – from strong bearish to strong bullish movements. Keeping these zones in sharp focus is essential for any optimization endeavor.

Market Condition Analysis

For starters, understanding the predominant market conditions is paramount. In a highly volatile market, the double Bollinger band strategy may present numerous potential trade signals as the price frequently touches and crosses the bands. Conversely, in a less volatile, ranging market, signals might be less frequent but can offer higher accuracy.

Adjusting the Time Frame

While many traders deploy the double Bollinger band strategy on daily charts, its versatility means it can be applied across multiple timeframes. Depending on your trading style – be it scalping, day trading, or swing trading – adjusting the timeframe can bring a fresh perspective and potentially more trade opportunities. Experimenting with different timeframes can reveal which one syncs best with your approach while leveraging the strengths of the double Bollinger band strategy.

Fine-Tuning the Deviations

The standard deviations of 1 and 2, defining the inner and outer bands respectively, are not set in stone. If you find that the price is too often breaching the outer bands or barely touching the inner bands, consider adjusting the deviations. This doesn’t mean a drastic change but maybe tweaking it to 1.1 or 1.9 can make all the difference in capturing optimal trade setups.

Combining with Other Indicators

One of the potent ways to enhance the effectiveness of the double Bollinger band strategy is to complement it with other technical indicators. For instance, integrating a momentum indicator can help confirm if a perceived trend has the strength to sustain. Or, using a volume indicator can validate if a breakout is backed by significant trading activity. The key is not to clutter the chart but to use complementary tools that reinforce the insights provided by the double Bollinger band strategy.

Regular Backtesting

Any optimization effort should be rooted in data. Periodically backtesting the double Bollinger band strategy ensures that the tweaks and adjustments align with the desired outcomes. It offers insights into what’s working and what needs further refinement.

Staying Educated and Updated

Lastly, the world of trading is in constant flux. New techniques, tools, and algorithms are continually emerging. By staying educated and updated, you can harness the latest methodologies to fine-tune the double Bollinger band strategy, ensuring that it remains a robust and reliable tool in your trading arsenal.

Conclusion

The Double Bollinger Band Strategy is a formidable tool in a trader’s arsenal. Its ability to encapsulate price movements and market volatility offers traders a unique vantage point. While its merits are many, remember to always integrate it within a broader, well-structured trading plan. After all, in the dynamic world of trading, adaptability and a holistic approach often pave the way to success.

Bollinger Band Crossover Strategy: A Comprehensive Guide for Traders

Bollinger Band Crossover Strategy

Introduction

The Bollinger Bands are a renowned tool in the trading space, offering insights into price levels that are indicative of high and low volatility phases. Central to this tool is the Bollinger Band Crossover Strategy, a technique that leverages the signals generated when prices crossover the bands, helping to identify potential entry and exit points in the market. Before we delve into the depths of this strategy, let us first understand the Bollinger Bands’ basic components.

Understanding Bollinger Bands

The Bollinger Bands comprise three vital components: the upper band, the middle band, and the lower band. These bands are plotted two standard deviations away from a simple moving average (usually a 20-day moving average), providing a relative definition of high and low prices. The middle band represents the moving average, while the upper and lower bands provide a statistical range within which prices are likely to oscillate. Understanding these components is foundational to mastering the ”Bollinger Band Crossover Strategy”, as it is the intersection of prices with these bands that signal potential trading opportunities.

Setting up for Success: Tools and Tips

Trading in the world of finance can often resemble a high-octane chess game, where strategies, predictions, and timely decisions can mean the difference between a win and a loss. For many traders, the bollinger band crossover strategy stands out as a notable technique, helping them navigate the volatile terrains of the market. But like every strategy, it requires an apt setup for maximum efficiency. Here, we’ll delve deeper into setting up for success using the ”bollinger band crossover strategy”, discussing essential tools and tips that can boost its effectiveness.

Choosing the Right Charting Software:

  1. Interactive Charts: Your selected charting software should provide interactive charts, allowing traders to zoom in and out to understand price action better, crucial for implementing the bollinger band crossover strategy effectively.
  2. Customization: Every trader has their unique style. A flexible charting software lets traders customize Bollinger Band settings to suit their individual preferences, enhancing the bollinger band crossover strategy.
  3. Multiple Timeframes: The bollinger band crossover strategy can be applied across different timeframes. Whether you’re a day trader or prefer longer periods, your software should cater to all needs.

Timeframes and Periods:

The effectiveness of the bollinger band crossover strategy can vary depending on the timeframe.

  1. Short-Term: On hourly or even minute charts, the bollinger band crossover strategy can provide quick signals, suitable for traders looking for short-term opportunities.
  2. Long-Term: For those eyeing more prolonged trends, daily or weekly charts might be more appropriate. Here, the bollinger band crossover strategy can offer insights into broader market movements.

Fine-Tuning the Strategy:

While Bollinger Bands often use a 20-day moving average and two standard deviations as a default, tweaking these numbers can sometimes enhance the ”bollinger band crossover strategy” based on the asset and market condition.

  1. Adjusting the Period: A shorter moving average period might make the bands more responsive to price changes, potentially making the bollinger band crossover strategy more dynamic. Conversely, a longer period might smoothen out the bands, filtering minor price fluctuations.
  2. Modifying Standard Deviation: This defines the width between the bands. A larger number will make the bands wider, capturing more significant price moves, potentially offering more robust signals for the bollinger band crossover strategy.

Alerts and Notifications:

To maximize the ”bollinger band crossover strategy”, ensure that your tools allow setting up alerts. Immediate notifications when prices approach, touch, or cross the Bollinger Bands can be invaluable. It ensures that you don’t miss potential trading opportunities the strategy identifies.

Backtesting:

Before committing to live trades, it’s wise to backtest the ”bollinger band crossover strategy” with your setup. Backtesting lets you see how the strategy would have performed in the past, providing insights into potential adjustments and optimizations.

Continuous Learning:

Trading tools and software continuously evolve. Staying updated with the latest features and understanding how they can complement the ”bollinger band crossover strategy” is essential. Attend webinars, read relevant literature, and participate in community discussions. The more you learn, the better equipped you’ll be to leverage the strategy to its fullest potential.

How the Crossover Strategy Works

Trading in the financial markets requires a keen sense of observation, the right tools, and effective strategies. One of the standout strategies that has gained traction among both novice and seasoned traders is the bollinger band crossover strategy. But what makes this strategy tick, and how do traders leverage it for maximizing their profits? Let’s dive deeper.

Foundations of the Bollinger Band Crossover Strategy

At its core, the bollinger band crossover strategy relies on the movement of prices in relation to the Bollinger Bands. These bands consist of three lines: the middle band (a simple moving average), and two outer bands that are standard deviations away from this moving average. The essence of the strategy lies in observing how and when the price of an asset crosses these bands.

The Two Types of Crossovers

The bollinger band crossover strategy primarily deals with two distinct types of crossovers:

  1. Price-Middle Band Crossover: This happens when the price crosses the middle band, which is the simple moving average. A crossover above the middle band can be an indicator of a potential bullish trend, suggesting that the asset might be gaining upward momentum. On the other hand, a crossover below the middle band can be seen as a bearish signal, hinting at a potential downward movement.
  2. Price-Outer Band Crossover: This type of crossover is particularly intriguing for traders. When the price of an asset moves beyond the upper band, it can be an indication that the asset is overbought, and a reversal might be on the cards. Conversely, if the price dips below the lower band, it might be a sign that the asset is oversold, and an upward correction could be imminent. It’s essential to note that the bollinger band crossover strategy doesn’t solely rely on these crossovers for trade signals but uses them as key reference points.

Enhancing the Strategy with Confirmations

One of the strengths of the bollinger band crossover strategy is its adaptability. While the crossovers provide a primary signal, traders often seek additional confirmation before executing trades. For instance, after observing a bullish crossover above the middle band, a trader might wait for the asset’s price to establish a consistent upward pattern or look for other technical indicators that affirm the bullish trend.

Challenges and Caveats

No strategy is infallible, and the bollinger band crossover strategy is no exception. While it provides traders with valuable insights, there are challenges. One of the primary concerns is the occurrence of false signals. A price might cross one of the bands but reverse its direction shortly after. This can lead to false breakouts or breakdowns. Therefore, traders who swear by the bollinger band crossover strategy often combine it with other technical analysis tools to filter out potential false signals.

Adapting to Volatility

Volatility plays a crucial role in the bollinger band crossover strategy. During periods of high volatility, the bands expand, indicating that the asset is experiencing significant price fluctuations. Conversely, during low volatility phases, the bands contract, suggesting that the asset is trading in a narrow range. Understanding these dynamics is vital for traders, as it can provide insights into potential breakout or breakdown moments, thus informing the timing and nature of their trades.

Complementary Indicators

1. Moving Average Convergence Divergence (MACD)

The MACD is a trend-following momentum indicator that reveals the relationship between two moving averages of an asset’s price. When the MACD line crosses above its signal line, it might be an indication to buy, whereas a cross below the signal line might suggest a sell. By combining the insights from MACD with the bollinger band crossover strategy, traders can filter out potential false signals, ensuring that the momentum supports the crossover’s direction.

2. Relative Strength Index (RSI)

RSI is a momentum oscillator that measures the speed and change of price movements. It oscillates between zero and 100 and is typically used to identify overbought or oversold conditions in a traded asset. When the RSI is above 70, it indicates that the asset might be overbought, and when it’s below 30, it may be oversold. By using RSI in conjunction with the bollinger band crossover strategy, traders can determine if the price breakout is due to genuine demand or if the asset is merely moving due to overextension.

3. Stochastic Oscillator

The stochastic oscillator compares a particular closing price of an asset to a range of its prices over a certain period. It generates values between 0 and 100 and is used to gauge momentum and potential trend reversals. Similar to the RSI, levels above 80 are deemed overbought, and levels below 20 are considered oversold. When these levels align with the signals from the bollinger band crossover strategy, it can further validate the strength or weakness of the asset’s momentum.

4. Volume Indicators

Volume is a vital component in confirming price trends. A high volume indicates strong interest and validation in the price movement, while low volume may suggest a lack of conviction behind the move. On-Balance Volume (OBV) is one such volume indicator that ties volume to price change. A rising OBV reflects positive volume pressure that can lead to higher prices. Using volume indicators alongside the bollinger band crossover strategy can help confirm the strength of potential breakouts or breakdowns.

5. Average True Range (ATR)

The ATR measures market volatility. It doesn’t provide an indication of price trend, but rather the degree of price volatility. For traders employing the bollinger band crossover strategy, understanding volatility can be crucial. If the market is more volatile, the bands widen, and during less volatile periods, the bands contract. By integrating insights from ATR, traders can ensure that they are not misinterpreting price movements that are merely a result of increased volatility.

Risks and Limitations

1. False Signals with the Bollinger Band Crossover Strategy

One of the most frequent challenges traders encounter with the Bollinger Band Crossover Strategy is the occurrence of false signals. A false signal refers to a scenario where, despite the price crossing over the band indicating a potential trading opportunity, the market doesn’t follow the expected trend. This can result in a trader making an entry or exit decision based on misleading information. Traders relying solely on the Bollinger Band Crossover Strategy can sometimes be caught off guard by these deceptive market moves.

2. Volatility Misinterpretation

While Bollinger Bands are designed to adapt to volatility, sudden and extreme price movements can sometimes mislead the bands’ representation. The Bollinger Band Crossover Strategy heavily depends on understanding and interpreting volatility. In cases of sharp price fluctuations, traders might misinterpret the bands’ width expansion as a continuation of a trend, when it could just be a temporary market reaction.

3. Dependence on Historical Data

The Bollinger Band Crossover Strategy, like many technical indicators, relies on past market data to determine future possibilities. While history often repeats itself in the market, relying solely on historical data can be limiting. There are times when unforeseen market events cause drastic shifts in price, making the predictions based on the Bollinger Band Crossover Strategy less accurate.

4. Risk of Over-reliance

The allure of the Bollinger Band Crossover Strategy is undeniable, given its potential to highlight market entry and exit points. However, over-relying on this single strategy without considering other market indicators can be perilous. No trading strategy, including the Bollinger Band Crossover Strategy, offers a bulletproof method. Diversifying analysis techniques and not putting all faith in one approach is often the key to a balanced trading approach.

5. Challenges in Sideways Markets

In consolidating or sideways markets, where prices move within a relatively stable range, the effectiveness of the Bollinger Band Crossover Strategy can diminish. The prices tend to hover around the middle band, resulting in frequent crossovers that might not result in significant price movements. This can lead to overtrading or misreading the market’s direction, impacting profitability.

6. Reactionary Delays

Another limitation to consider is the slight delay that might occur before the Bollinger Bands adjust to recent price changes. Since they’re based on moving averages, there’s an inherent lag. While the Bollinger Band Crossover Strategy helps predict potential future movements, it does so based on recent past prices, which might not always provide real-time accuracy.

Optimizing the Crossover Strategy

Understanding the Basics

Before diving into optimization, it’s crucial to understand the essence of the bollinger band crossover strategy. This strategy primarily revolves around the interaction between price movement and the Bollinger Bands. When prices intersect with the middle band (which is essentially a moving average), it signals potential market entry or exit points. The challenge, however, is ensuring that these signals are reliable and actionable.

Recognizing the Market Conditions

The effectiveness of the bollinger band crossover strategy can be dramatically influenced by prevailing market conditions. In a trending market, for instance, crossovers that occur after a touch of the upper or lower band can be more reliable than those that don’t. Conversely, during sideways or consolidating markets, prices might frequently cross the bands, leading to many false signals.

To optimize the bollinger band crossover strategy, traders must be adept at recognizing the current market phase and adjust their approach accordingly. This might mean using the strategy more judiciously during consolidation phases and with more confidence during strong trends.

Fine-Tuning the Parameters

While Bollinger Bands are typically set with a 20-day moving average and a 2 standard deviation, these settings might not always be ideal for every asset or market condition. By adjusting the period of the moving average or the standard deviation, traders can customize the sensitivity of the bands.

For volatile markets, increasing the standard deviation can make the bands wider, filtering out minor price fluctuations and focusing on more significant crossovers. In contrast, decreasing the standard deviation in more stable markets can make the bands more responsive. Fine-tuning these parameters can make the bollinger band crossover strategy more adaptive to the asset being traded and the prevailing conditions.

Incorporating Additional Indicators

While the bollinger band crossover strategy is powerful on its own, its efficacy can be enhanced when combined with other technical indicators. For example, using momentum oscillators like the Relative Strength Index (RSI) can help validate a crossover signal. If a bullish crossover is accompanied by an RSI reading that indicates an oversold condition, the buy signal becomes more robust.

Similarly, volume indicators can provide insights into the strength behind a particular move. A bullish crossover with increasing volume might suggest a strong upward trend, making the bollinger band crossover strategy signal even more compelling.

Implementing Robust Risk Management

Optimizing the bollinger band crossover strategy isn’t just about enhancing entry signals; it’s also about managing potential downside. Incorporating stop-loss orders and setting profit targets can ensure that the strategy remains profitable over the long term. By defining risk parameters and sticking to them, traders can ensure that even when the market goes against them, their losses are contained.

Continual Backtesting and Learning

The financial markets are dynamic, and what worked yesterday might not necessarily work tomorrow. For this reason, continual backtesting of the bollinger band crossover strategy against historical data is crucial. By analyzing how the strategy would have performed in various market scenarios, traders can identify potential weaknesses and areas for improvement.

Conclusion

The Bollinger Band Crossover Strategy emerges as a potent tool in the trader’s toolkit, offering valuable insights into potential market movements and trading opportunities. By understanding the intricacies of this strategy and integrating it with other technical indicators, traders can forge a path to successful trading. As we wrap up, we encourage traders to practice diligently and continually educate themselves to harness the full potential of the Bollinger Band Crossover Strategy.

Bollinger Band Breakout Screener: The Ultimate Guide for Modern Traders

Bollinger Band Breakout Screener

Introduction

Bollinger Bands have long been a staple in the toolkit of many traders. Originating as a tool to gauge volatility, they’ve grown in usage due to their intuitive design and practical application. Within this context, the Bollinger Band Breakout becomes a focal point, presenting lucrative trading opportunities. Yet, how do traders efficiently spot these breakouts? Enter the Bollinger Band Breakout Screener. A tool designed to filter through the noise and highlight potential breakout scenarios.

Understanding Screeners in Trading

Trading in the financial markets can often seem like searching for a needle in a haystack. With thousands of stocks, commodities, and currencies to choose from, finding the right trading opportunity at the right time is daunting. This is where trading screeners come in, acting as filters to highlight potential investment avenues based on predefined criteria. One such innovative tool that’s captured the attention of traders globally is the Bollinger Band Breakout Screener.

What are Trading Screeners?

At its core, a trading screener is a digital tool designed to filter through vast amounts of market data to pinpoint specific conditions or criteria set by the trader. Imagine sifting through thousands of stock charts daily. Not only is this task time-consuming, but it’s also prone to human error. Trading screeners automate this process, scanning the markets continuously and alerting traders to potential opportunities.

The Rise of the Bollinger Band Breakout Screener

Among the myriad of screeners available, the Bollinger Band Breakout Screener stands out, especially for those keen on volatility-based trading strategies. Bollinger Bands, a popular technical analysis tool, essentially provides a visual representation of an asset’s price volatility. When prices break through these bands, it often signifies significant price movement, be it upward or downward.

The Bollinger Band Breakout Screener focuses on these breakout moments. Instead of traders having to monitor multiple charts to catch a breakout, this screener alerts them the moment a potential breakout is on the horizon. It streamlines the process, ensuring traders don’t miss out on potential opportunities.

How Does the Bollinger Breakout Screener Work?

The efficiency of the Bollinger Band Breakout Screener lies in its methodology. The screener constantly tracks the proximity of asset prices to the Bollinger Bands. Once a price touches or crosses these bands, the screener flags it.

For traders, this is invaluable. A breakout can indicate the start of a new trend or a false breakout, leading to a price reversal. Having a tool that alerts them to such movements in real-time allows for quick decision-making and strategy adjustment.

Why Use the Bollinger  Breakout Screener?

The Bollinger Band Breakout Screener isn’t just about convenience; it’s about enhancing trading strategies. By focusing on Bollinger Band breakouts, traders can:

  1. Increase Efficiency: Instead of manually tracking multiple assets, the screener does the heavy lifting.
  2. Reduce Emotional Trading: Relying on a systematic tool minimizes impulsive decisions and enhances objective trading.
  3. Integrate with Other Tools: The Bollinger Band Breakout Screener can be combined with other indicators to refine trading signals further.

The Essence of the Bollinger Band Breakout

The trading world is intricate, with a myriad of tools and techniques to help traders decipher the most opportune moments to enter or exit a trade. Among these tools, Bollinger Bands stand out, often hailed for their practicality and dynamic nature. But what truly captivates traders globally is the pivotal moment of a Bollinger Band breakout. To truly harness its essence and potential, the bollinger band breakout screener becomes a quintessential tool for every trader.

Bollinger Bands: A Brief Overview

Before diving into the core of the breakout, let’s get a grasp on Bollinger Bands themselves. Crafted by John Bollinger in the 1980s, these bands are volatility indicators placed above and below a moving average. Essentially, they adjust themselves based on market conditions. The wider the bands, the higher the volatility; conversely, narrow bands signify lower volatility.

Spotting the Breakout

A Bollinger Band breakout is when the price of an asset moves beyond the upper or lower band. It signifies that the asset is trading outside its usual volatility range, which could indicate a significant price move is looming. Traders look at these breakouts as signals, either to buy or sell, based on the direction of the breakout.

However, spotting a genuine breakout is where the challenge lies. Not all price movements beyond the band signify a sustainable trend. This is where the bollinger band breakout screener comes into play.

The Role of the Breakout Screener

So, what makes the bollinger band breakout screener so instrumental? First, it does the hefty task of scanning through countless assets, pinpointing those displaying breakout characteristics. Given that markets are inundated with data and rapid price changes, manual analysis can be both tedious and inefficient. The screener’s automation aids in detecting breakout opportunities swiftly and accurately.

Furthermore, the bollinger band breakout screener offers precision. While a visual scan might give traders a general idea, the screener’s algorithms ensure that the breakout detected meets specific criteria, reducing the chances of false alarms.

Integrating the Breakout and the Screener

For traders to fully capture the essence of the Bollinger Band breakout, integrating the knowledge of the breakout with the functionality of the bollinger band breakout screener becomes essential. The screener assists in:

  1. Timing: Ensuring traders can react promptly to a breakout.
  2. Validation: Confirming that a breakout is genuine and not just a false signal.
  3. Analysis: Providing a more in-depth look at the asset, especially when the screener is paired with other tools or indicators.

Components of the Bollinger Band Breakout Screener

1. Price Proximity to the Bollinger Bands

The most primary function of the Bollinger Band Breakout Screener is to assess where the current price stands concerning the Bollinger Bands. By doing so, the screener can instantly identify if the price is nearing or has crossed the upper or lower band – an early signal of a potential breakout or breakdown.

2. Adjustable Sensitivity

To cater to individual trading styles and market conditions, a good Bollinger Band Breakout Screener offers adjustable sensitivity settings. Traders can set the screener to alert them when the price is either very close to or slightly further away from the Bollinger Bands. This ensures that they can either adopt an aggressive stance, acting on early signals, or a conservative one, waiting for more confirmed moves.

3. Timeframe Flexibility

Different traders operate on different timeframes. Whether it’s intraday traders looking at 15-minute charts or swing traders analyzing daily charts, the Bollinger Band Breakout Screener allows for flexibility. By adjusting the screener’s timeframe, traders can receive alerts tailored to their specific trading style.

4. Historical Data Analysis

To gauge the significance of a potential breakout, it’s often helpful to understand past behavior. An advanced Bollinger Band Breakout Screener incorporates historical data, allowing traders to see past breakout instances and their subsequent price movements. This aids in forming a predictive analysis based on historical patterns.

5. Integration with Other Indicators

While the Bollinger Bands are potent on their own, they often shine brightest when combined with other indicators. A comprehensive Bollinger Band Breakout Screener integrates seamlessly with other technical analysis tools. For instance, a screener might highlight a breakout and simultaneously indicate an overbought status on the RSI (Relative Strength Index), providing traders with a richer context.

6. Alerts and Notifications

In the fast-paced world of trading, time is of the essence. A Bollinger  Breakout Screener excels in delivering real-time alerts and notifications, ensuring traders don’t miss potential breakout opportunities. These can be in the form of push notifications, emails, or even SMS, depending on the platform.

7. Customizable Visualization

For visual traders, how the data is represented can make a world of difference. Modern Bollinger Band Breakout Screeners often come with customizable visualization tools. Whether traders prefer candlestick patterns, bar graphs, or line charts, the screener accommodates these preferences while highlighting potential breakouts.

Choosing the Right Screener Tool

1. Defining Your Needs

Before diving into the marketplace of screeners, you need to outline what you require from a Bollinger Band Breakout Screener. Are you looking for real-time data or is end-of-day data sufficient? Do you prefer a simple interface or are advanced features like back-testing more up your alley? By clearly defining your requirements, you can focus on screeners that align with your trading strategy.

2. Database Size and Quality

A screener is only as good as the data it processes. When evaluating the right Bollinger Band Breakout Screener, consider its data sources. The best screeners pull data from reputable exchanges and financial institutions, ensuring accuracy and comprehensiveness. A comprehensive database can efficiently track more assets, giving traders a broader field of potential opportunities.

3. Frequency of Updates

In the fast-paced world of trading, outdated data can be a liability. The ideal Bollinger Band Breakout Screener should offer frequent updates, especially if you’re trading on smaller timeframes. Real-time data provides traders with the most up-to-date insights, helping them capitalize on emerging breakout opportunities as they occur.

4. User Interface and Usability

A complex tool isn’t necessarily a better one. The right Bollinger Band Breakout Screener should strike a balance between advanced features and user-friendly interfaces. Especially for traders who aren’t tech-savvy, an intuitive design can make all the difference. Features like customizable filters, visual charts, and alert systems can greatly enhance the user experience.

5. Versatility and Integration

While the primary goal is to identify Bollinger Band breakouts, the most effective screeners often integrate with other indicators and tools. For instance, a Bollinger Band Breakout Screener that also interfaces with the Relative Strength Index (RSI) or Moving Averages can provide a more holistic view of the market, allowing for more informed decisions.

6. Price Point

Price is always a consideration. Some screeners are free but may come with limitations or ads, while others have monthly subscription fees but offer a plethora of advanced features. Weigh the benefits against the costs. Sometimes, investing in a more sophisticated Bollinger  Breakout Screener can lead to increased profits in the long run.

7. Community and Support

A vibrant community and robust support system can be invaluable. A Bollinger Band Breakout Screener backed by a community means access to shared insights, strategies, and potential troubleshooting help. Moreover, companies that prioritize customer support can guide users in maximizing the tool’s potential.

Maximizing the Use of the Bollinger Breakout Screener

1. Understanding the Core Functionality

At its heart, the Bollinger Band Breakout Screener scans the market for instances when a particular asset’s price breaches the confines of its Bollinger Bands, indicating a potential breakout. A deep understanding of how the screener functions, including its algorithms and criteria for determining breakouts, is crucial. This ensures you’re well-prepared to interpret and act upon the results it produces.

2. Customizing Settings for Specific Markets

While a one-size-fits-all approach might work for some, the Bollinger Breakout Screener truly shines when tailored to specific markets or assets. Different markets have unique volatilities and behavioral patterns, which means the screener’s default settings might not always be optimal. Regularly tweaking and testing the settings can refine your results, ensuring the screener is attuned to your specific trading environment.

3. Integrating Additional Indicators

The Bollinger Band Breakout Screener is a powerful tool, but when combined with other indicators, it becomes even more potent. Consider cross-referencing screener results with indicators like the Relative Strength Index (RSI), Moving Average Convergence Divergence (MACD), or even simple moving averages. This multi-faceted approach can provide a fuller picture, helping you discern between genuine breakout opportunities and false alarms.

4. Setting up Timely Alerts

Time is of the essence in trading, and responding swiftly to a potential breakout can be the difference between profit and loss. Customize your Bollinger Band Breakout Screener to send real-time alerts or notifications. Whether it’s an email, a mobile push notification, or an audible alarm, make sure you’re immediately informed when the screener spots a potential opportunity.

5. Regularly Reviewing and Adjusting

Markets evolve, and what worked yesterday might not be as effective today. Regularly review the performance of your Bollinger Band Breakout Screener. Are there too many false positives? Or perhaps it’s missing potential breakouts? By routinely assessing and recalibrating the screener’s settings, you ensure it remains an effective tool in your trading toolkit.

6. Educating Yourself Continually

The Bollinger Band Breakout Screener, like all trading tools, is as effective as the trader using it. Dedicate time to educating yourself not just on the screener but also on broader market trends, Bollinger Band strategies, and technical analysis nuances. The more you know, the better equipped you’ll be to interpret the screener’s results and make informed decisions.

7. Avoiding Over-reliance

While the Bollinger Band Breakout Screener is undoubtedly an asset, it shouldn’t be the sole basis for your trading decisions. Always use the screener as part of a broader strategy, taking into account other indicators, market news, and fundamental analysis. A balanced, holistic approach to trading invariably yields the best results.

Automating the Screening Process

1. The Role of the Bollinger  Breakout Screener in Automation:

Automation in trading is all about reducing the manual effort involved in repetitive tasks and enhancing accuracy. The Bollinger Band Breakout Screener is designed to identify potential breakout points automatically. Instead of traders poring over countless charts to spot these crucial moments, the screener does the heavy lifting.

2. Setting Up Automatic Alerts:

One of the most significant advantages of the Screener is its capability to set up automatic alerts. These alerts can be configured to notify a trader the moment a potential breakout is detected. Whether it’s through a pop-up notification on your trading platform, an email, or a message on your mobile trading app, you’re instantly in the loop, enabling quick action.

3. Integrating with Trading Bots:

The modern trader often leverages trading bots to execute trades based on certain predefined conditions. With the Bollinger Breakout Screener, this becomes especially relevant. Once the screener identifies a potential breakout, it can send a signal to a trading bot to execute a trade. This ensures that the trader can capitalize on opportunities even if they aren’t actively monitoring the market.

4. Continuous Monitoring and Updates:

Automation doesn’t mean “set it and forget it.” The Bollinger  Breakout Screener continuously monitors the markets across various timeframes. Whether you’re a day trader focusing on short intervals or a swing trader analyzing daily charts, the screener keeps scanning, ensuring no potential breakout goes unnoticed.

5. The Flexibility of Customization:

The Bollinger  Breakout Screener isn’t a rigid tool. Modern iterations of the screener allow for customization. Traders can adjust the sensitivity of the breakout parameters, ensuring the screener aligns with their trading strategy. This ensures that alerts and automation are fine-tuned to individual trading styles.

6. The Balance of Automation and Manual Oversight:

While the Breakout Screener offers a high degree of automation, it’s vital for traders to maintain manual oversight. The screener provides data and potential signals, but market conditions, news events, and other external factors can influence trade outcomes. A balanced approach, where the screener’s insights are complemented by human judgment, often yields the best results.

Conclusion

The Bollinger  Breakout Screener emerges as an invaluable tool in a trader’s arsenal. By efficiently identifying breakout scenarios, it saves time and introduces an element of objectivity into the trading process. However, like all tools, its efficiency lies in its user’s ability to wield it effectively. Continuous practice, refinement, and integration with other trading tools remain crucial for maximizing its potential.

RSI Bollinger Bands TradingView: Mastering the Confluence for Better Predictions

rsi bollinger bands tradingview

In the dynamic world of trading, tools and techniques that enhance prediction accuracy can be instrumental to success. TradingView, with its state-of-the-art charting tools, allows traders to employ a myriad of such techniques. One compelling combination that has garnered significant attention is the use of rsi bollinger bands tradingview. This strategy uses the confluence of two renowned indicators: the Relative Strength Index (RSI) and Bollinger Bands.

Deep Dive into RSI (Relative Strength Index)

At its core, RSI gauges the momentum of price movements. By scaling between 0 to 100, it provides insights into whether a particular asset is being overbought or oversold. Traditionally, an RSI value above 70 suggests an overbought condition, while below 30 indicates oversold. This can be a preliminary signal for traders to anticipate a potential price reversal. But using RSI alone might lead to premature or even false trading signals.

The Mechanics of Bollinger Bands

Bollinger Bands further refine the trading landscape. Comprising three bands – the middle, upper, and lower – these bands encapsulate price movements. The middle band represents a simple moving average, while the outer bands adjust themselves based on price volatility. As prices near the edge of these bands, traders might foresee a reversion towards the mean, i.e., the middle band. However, Bollinger Bands, when used in isolation, might not always provide a clear trading signal.

The RSI-Bollinger Bands Confluence

Herein lies the beauty of the rsi bollinger bands tradingview strategy. By integrating the insights of RSI (momentum) with the volatility indications from Bollinger Bands, traders can pin down more robust trading signals. For instance, when an asset’s price touches the upper Bollinger Band while the RSI indicates overbought conditions, there’s a heightened chance of a price dip.

Setting Up RSI and Bollinger Bands on TradingView

Navigating the realm of technical analysis can be daunting, especially with the myriad of tools and indicators available. Yet, among the plethora, some stand out due to their efficacy and widespread use. Two such indicators are the Relative Strength Index (RSI) and Bollinger Bands. Their combined use on platforms like TradingView can offer traders a nuanced understanding of market conditions. This guide will walk you through the process of integrating the rsi bollinger bands tradingview approach into your analysis.

1. Launching TradingView:

To start your journey with the rsi bollinger bands tradingview method, you’ll first need to launch TradingView in your preferred browser. TradingView is widely regarded for its user-friendly interface, making the setup process smooth even for beginners.

2. Selecting Your Desired Asset Chart:

Once logged in or even as a guest, select the financial asset you intend to analyze. This could be anything from a stock, a cryptocurrency, a forex pair, or any other tradable asset available on the platform.

3. Accessing the Indicators Tab:

At the top of the chart screen, you’ll notice an ‘Indicators’ button. Clicking on this will open a dropdown menu with a plethora of available indicators. For the rsi bollinger bands tradingview setup, you’ll be focusing on the RSI and Bollinger Bands.

4. Integrating the RSI:

In the search bar of the indicators menu, type in “RSI” or “Relative Strength Index”. Click on it, and it will be added to your chart. By default, the RSI often comes with a period setting of 14, but this can be adjusted based on your trading strategy.

5. Incorporating the Bollinger Bands:

Similarly, search for “Bollinger Bands” in the indicators search bar. Upon adding it, you’ll notice three bands on your chart – the middle band (a simple moving average), and two outer bands representing standard deviation moves from the middle band.

6. Customizing the Settings:

Both RSI and Bollinger Bands come with default settings, but TradingView allows for customization. Clicking on the settings icon (appearing as a gear) for each indicator will open a menu where periods, colors, and other parameters can be adjusted. The flexibility in settings ensures that traders can tailor the rsi bollinger bands tradingview technique to their specific needs.

7. Reading the RSI Bollinger Bands Confluence on TradingView:

Once both indicators are set up, observe how they interact. If an asset’s price touches the upper Bollinger Band while the RSI indicates an overbought condition, there might be potential for a price reversal. Conversely, a touch on the lower Bollinger Band with an RSI reading below 30 (indicating oversold) can signal a potential upward movement.

8. Enhancing Analysis with Additional Tools:

While the rsi bollinger bands tradingview combination is potent, it’s further amplified when used in tandem with other tools available on TradingView, like trend lines or volume data. This multi-layered approach provides traders with a more comprehensive view of the market.

9. Keeping an Active Trading Community at Hand:

One of the strengths of TradingView is its active community. Exploring public charts, published ideas, or the chat function can provide additional insights into the rsi bollinger bands tradingview strategy. Engaging with other traders can reveal unique interpretations and uses of this combined indicator approach.

Strategic Insights for Using the Combo on TradingView

To master the art of trading using the rsi bollinger bands tradingview strategy, traders must delve deep into the nuances that come with the integration of two powerful technical indicators. These insights can potentially elevate trading strategies, offering a deeper perspective into market behaviors and trends.

Identifying Overbought and Oversold Territories

Utilizing the rsi bollinger bands tradingview effectively means being able to identify overbought and oversold territories with greater precision. When the market reaches the upper band of the Bollinger and the RSI crosses the 70 mark, it might be an indication of an overbought condition. Conversely, when the market hits the lower band and the RSI drops below 30, it signals an oversold condition. These critical points can potentially serve as entry or exit points, but traders must remain vigilant and corroborate these signals with other market factors.

Capitalizing on Volatility

Volatility is a double-edged sword in trading. While it presents opportunities, it also brings risks. The rsi bollinger bands tradingview strategy allows traders to navigate volatility with more data and insights at hand. During high volatility periods, the bands expand, and when the market is stable, the bands contract. This band behavior, combined with RSI readings, can help traders strategize better and perhaps identify potential breakout or breakdown points before they happen.

Fine-Tuning Trading Signals

TradingView offers customization options that enable traders to tailor the rsi bollinger bands tradingview settings to their preferences. This flexibility can be instrumental in filtering noise and focusing on more significant signals. For instance, increasing the period setting of the Bollinger Bands may help in identifying long-term trends, while adjusting the RSI settings can help in reducing false signals, fostering a strategy that is more in line with a trader’s risk tolerance and trading style.

Divergence – A Critical Component

One of the core strategies in trading with the rsi bollinger bands tradingview approach is to look for divergences. Divergence happens when the price of an asset is moving in the opposite direction of the RSI. This can sometimes signal a potential reversal. Traders must practice discerning genuine divergences from false alarms to capitalize on potential opportunities.

Leveraging Community Insights

TradingView hosts a vibrant community where traders share their insights and strategies, including experiences with the rsi bollinger bands tradingview approach. Engaging with this community can provide traders with different perspectives, potentially unveiling new strategies or modifications that can be beneficial.

Continuous Learning and Adaptation

The world of trading is dynamic, with market conditions changing rapidly. Traders utilizing the rsi bollinger bands tradingview approach should remain committed to learning and adapting their strategies to align with evolving market conditions. It’s essential to be aware of the broader economic indicators and news events which might influence asset prices.

Advantages of Using TradingView for RSI-Bollinger Bands Analysis

When it comes to charting and analysis tools for traders and investors, TradingView has rapidly emerged as one of the top contenders. Its robust functionality combined with a user-friendly interface makes it a go-to platform for many. Specifically, when employing a combined technical strategy such as the rsi bollinger bands tradingview approach, the advantages become even more pronounced.

  1. Seamless Integration of Tools: The first clear advantage is the platform’s ability to seamlessly integrate both RSI and Bollinger Bands into one cohesive chart. This ease of use means that traders can quickly overlay the rsi bollinger bands tradingview on any asset of their choice without jumping through hoops.
  2. Customization and Flexibility: TradingView allows users to adjust the settings for both RSI and Bollinger Bands. This means that if a trader wants to experiment with the parameters, perhaps using a 10-day RSI instead of the traditional 14-day, the rsi bollinger bands tradingview setup can be easily tweaked to fit these preferences.
  3. Real-time Data: For technical strategies to be effective, real-time data is crucial. The rsi bollinger bands tradingview combination relies on timely information to gauge potential overbought or oversold conditions, and TradingView delivers this data seamlessly.
  4. Interactive Learning through Community Features: One of the standout features of TradingView is its active community. As traders worldwide share their insights on the rsi bollinger bands tradingview technique, both novices and veterans can glean new perspectives and refine their strategies. This interactive learning is invaluable in the dynamic world of trading.
  5. Alerts and Notifications: When employing the rsi bollinger bands tradingview strategy, certain conditions might signal trading opportunities. TradingView’s advanced alert system ensures that traders don’t miss these potential signals by providing timely notifications when specific criteria are met.
  6. Historical Data Analysis: Backtesting is a vital part of refining any trading strategy. With TradingView, traders can assess how the rsi bollinger bands tradingview approach would have performed in past market conditions, aiding in the refinement and optimization of the strategy for future trades.
  7. Platform Stability and Speed: Nothing is more frustrating for a trader than a platform that lags, especially when precise timing is crucial. TradingView is known for its stability, ensuring that the rsi bollinger bands tradingview analysis occurs without hitches.
  8. Cross-device Functionality: In today’s world, traders are not confined to their desktops. Many prefer to analyze on the go. TradingView’s compatibility across devices ensures that the rsi bollinger bands tradingview strategy can be assessed from a desktop, tablet, or mobile device with equal ease.
  9. Educational Resources: For those new to the rsi bollinger bands tradingview combination, TradingView provides a plethora of educational resources, tutorials, and webinars. This ensures that users can quickly get up to speed and utilize the strategy effectively.
  10. Cost-effective Premium Features: For those who opt for the premium versions of TradingView, additional features such as more indicators on a single chart or enhanced data speed make the rsi bollinger bands tradingview analysis even more efficient.

Common Misconceptions and Pitfalls

The trading world is replete with tools and indicators designed to offer traders an edge. Among the myriad of combinations available, the confluence of RSI and Bollinger Bands on TradingView has emerged as a popular choice for many. The rsi bollinger bands tradingview strategy offers a unique blend of momentum and volatility insights, designed to pinpoint potential trading opportunities. However, as with all trading tools, there are some misconceptions and pitfalls that traders should be aware of.

  1. The Foolproof Fallacy: One major misconception is that using the rsi bollinger bands tradingview strategy guarantees profitable trades. Some beginners believe that when both RSI and Bollinger Bands give a synchronized signal, it’s an absolute green light. However, no trading strategy is infallible. Every approach has its limitations, and there will always be market scenarios where the strategy might not perform as expected.
  2. Over-reliance on Default Settings: TradingView offers default settings for both RSI and Bollinger Bands. However, sticking to these without customization can be detrimental. The rsi bollinger bands tradingview combination might require adjustments depending on the asset being traded or the prevailing market conditions. It’s essential to test and tweak the settings to find the optimal configuration for one’s specific trading scenario.
  3. Misinterpreting Overbought and Oversold Conditions: Just because RSI indicates an overbought or oversold condition when used in the rsi bollinger bands tradingview strategy doesn’t mean an immediate reversal will happen. The market can remain overbought or oversold for extended periods, and acting prematurely can lead to losses.
  4. Ignoring Broader Market Context: While the rsi bollinger bands tradingview strategy provides valuable signals, it doesn’t operate in isolation. External factors such as major economic news, geopolitical events, or sudden market shocks can drastically influence asset prices. Ignoring these while solely relying on the strategy can result in misguided trades.
  5. Overtrading Based on Minute Signals: The rsi bollinger bands tradingview combination can sometimes produce multiple signals in a short timeframe, especially in volatile markets. However, not every signal warrants a trade. Overtrading can lead to significant losses, especially if traders disregard the quality of signals and chase quantity instead.
  6. Neglecting Other Confirmatory Indicators: While the rsi bollinger bands tradingview combo is powerful, integrating it with other technical tools can enhance its accuracy. Sole reliance on this duo without considering other indicators for confirmation might not be the most comprehensive approach.
  7. Overlooking the Basics of Money Management: Using the rsi bollinger bands tradingview strategy doesn’t absolve traders from following sound money management principles. It’s crucial to set stop losses, decide on appropriate position sizes, and have a clear exit strategy in place.

Ensuring Continual Learning on TradingView

TradingView is a treasure trove for traders. Beyond its real-time charts and advanced features, it’s an evolving ecosystem that promotes learning and adaptation. While seasoned traders often employ strategies like rsi bollinger bands tradingview, beginners and intermediates can capitalize on the platform’s rich resources to continually enhance their trading acumen.

1. Dive Deep into the Community Discussions

One of TradingView’s crown jewels is its active community. Here, traders from all over the world discuss strategies, dissect charts, and share their perspectives. By participating or even by simply observing, one can gain insights into the application of different strategies, including the nuances of rsi bollinger bands tradingview. Engaging with others who use this approach can provide clarity, answer questions, and introduce nuances that beginners might not be aware of.

2. Regularly Explore the ‘Public Library’

TradingView’s Public Library is home to thousands of custom-built indicators and strategies. As trading techniques evolve, so does the library’s repository. Users often contribute newer versions of established methods, including variations of rsi bollinger bands tradingview, optimized based on their personal experiences. By regularly checking the Public Library, one can stay updated with the latest tweaks and improvements to this strategy.

3. Attend Webinars and Training Sessions

TradingView occasionally hosts webinars and training sessions focusing on specific tools, strategies, and market analyses. Attending these can provide a comprehensive understanding of various techniques, including the practical applications of rsi bollinger bands tradingview. Such sessions often delve deeper than general discussions, offering attendees step-by-step guidance.

4. Engage with Published Charts

Numerous traders publish their charts embedded with annotations, predictions, and strategies on TradingView. By analyzing these charts, learners can see real-world applications of techniques like rsi bollinger bands tradingview in different market conditions. Understanding the rationale behind each move or prediction on these charts can offer valuable learning moments.

5. Practice Using the ‘Paper Trading’ Feature

Before diving into live markets, beginners can use TradingView’s Paper Trading feature to practice their strategies. This risk-free environment is ideal for testing the efficacy of techniques such as rsi bollinger bands tradingview without the fear of incurring losses. With consistent practice, one can identify areas of improvement and refine the strategy further.

6. Stay Updated with Platform Enhancements

TradingView is a dynamic platform that frequently rolls out updates, adding features or refining existing ones. Staying updated ensures that traders can make the most of the platform, optimizing their use of strategies like rsi bollinger bands tradingview. The site’s blog and update logs can be great resources to monitor these changes.

Conclusion

The power of the rsi bollinger bands tradingview combination is undeniable. When wielded correctly, it can open doors to more accurate predictions and better trading decisions. While no strategy can guarantee success, combining RSI’s momentum insights with Bollinger Bands’ volatility indications on a platform like TradingView is undoubtedly a step in the right direction for traders worldwide.

Bollinger Bands TradingView: Enhancing Technical Analysis through Visualization

Bollinger Bands TradingView

Introduction

The world of technical analysis is vast and diverse, offering traders a myriad of tools and techniques to predict future price movements. One such renowned tool is the Bollinger Bands. While understanding its mechanics is vital, the importance of visualizing this tool efficiently cannot be overstressed. This is where platforms like bollinger bands tradingview come into play, providing traders with a vivid representation of market data.

Understanding Bollinger Bands: A Recap

At its core, Bollinger Bands comprise three primary bands – the Middle, Upper, and Lower Bands. They collectively offer insights into potential price reversals, market volatility, and potential breakout points. The spacing between the bands fluctuates, indicating the degree of market volatility. The wider the bands, the higher the volatility and vice-versa.

TradingView: A Brief Overview

TradingView has quickly risen to prominence, offering a blend of charting tools and a vibrant community of traders. It’s more than just a platform; it’s a space where both novice and experienced traders converge, discussing strategies, chart patterns, and more. Among the many tools it offers, the bollinger bands tradingview feature stands out, particularly because of its user-friendly interface and real-time data presentation.

Setting Up Bollinger Bands on TradingView

1. Accessing TradingView’s Interface:

Before diving into the world of bollinger bands tradingview, ensure that you’ve signed up and logged into TradingView. With its user-friendly interface, even beginners find it relatively easy to navigate through the platform. The primary chart screen is where the magic of bollinger bands tradingview begins.

2. Navigating to the ‘Indicators’ Tab:

At the top of your screen, you’ll see a tab labeled ‘Indicators.’ This is essentially the gateway to all the technical analysis tools that TradingView offers, including the bollinger bands tradingview feature.

3. Searching for Bollinger Bands:

Upon clicking the ‘Indicators’ tab, a search bar will appear. Simply type “Bollinger Bands” into this space. As you begin typing, TradingView will display a list of related indicators. Among them, select Bollinger Bands to integrate it into your chart. This is the initial step into the world of bollinger bands tradingview, and you’re now ready to dive deeper.

4. Customizing Bollinger Bands on TradingView:

What makes bollinger bands tradingview truly special is the customization it offers. Once the Bollinger Bands are on your chart:

  • Click on the settings icon (represented by a gear) next to the Bollinger Bands title.
  • Here, you can adjust various parameters including the period (typically set at 20) and the standard deviation (usually set at 2). These parameters can be tweaked as per your trading strategy and analysis needs.
  • The ‘Style’ tab within the settings allows users to modify the colors of the bands, making the bollinger bands tradingview experience visually appealing and clear.

5. Using Bollinger Bands with Other Tools on TradingView:

The beauty of bollinger bands tradingview is that it doesn’t restrict you to one tool. You can seamlessly incorporate other technical indicators like RSI, MACD, or Moving Averages. This synergy between Bollinger Bands and other tools, all visualized on TradingView, provides a comprehensive view of the market.

6. Saving and Accessing Your Bollinger Bands Settings:

After customizing your bollinger bands tradingview as per your needs, remember to save the chart layout. This ensures that the next time you log into TradingView, your personalized settings are retained, and you can immediately dive into analysis without resetting your parameters.

Visualization Advantages of TradingView

TradingView is widely recognized for its comprehensive charting tools, clean interface, and a platform that caters to both novice and professional traders. When combined with technical analysis tools like the bollinger bands tradingview integration, the platform becomes an even more powerful asset for traders. Let’s delve deeper into the visualization advantages of using TradingView, especially when harnessing the bollinger bands tradingview toolset.

  1. Clarity and Precision: TradingView’s interface is known for its clarity. When traders overlay bollinger bands tradingview on their charts, the bands are distinct, ensuring that there’s no ambiguity in analyzing market movements. The sharpness of the bands against price data makes it easy to identify potential price reversals, breakouts, and areas of support and resistance.
  2. Customization: One of the standout features of TradingView is its customization capabilities. When using bollinger bands tradingview, traders can adjust the color of the bands, the period, and even the standard deviations to align with their personal preferences or to match other elements on their charts.
  3. Real-time Data Rendering: As the market conditions change, it’s essential to have a platform that updates without any significant lags. With bollinger bands tradingview on TradingView, the data gets rendered in real-time. This ensures traders get the most current view of the market, allowing them to make timely decisions.
  4. Zoom and Scroll Features: For traders who want to examine the bollinger bands tradingview in a specific timeframe, the zoom and scroll functionalities on TradingView are invaluable. Whether you want to view the bands in a macro perspective, spanning years, or in a micro perspective, focusing on hours or minutes, TradingView’s intuitive controls have got you covered.
  5. Integration with Other Indicators: TradingView allows for simultaneous usage of multiple indicators. When you’re analyzing the market with bollinger bands tradingview, you can effortlessly overlay other indicators like the Relative Strength Index (RSI) or Moving Averages. This comprehensive view ensures traders get a multi-dimensional perspective of the market.
  6. Interactive Annotations: While bollinger bands tradingview provides dynamic insights, there are times when traders wish to make notes directly on the chart. TradingView offers a range of drawing tools and annotations, enabling traders to mark significant points, draw trend lines, or even jot down their observations without leaving the platform.
  7. Device Responsiveness: The modern trader isn’t confined to a desk. With TradingView’s responsive design, the bollinger bands tradingview charts are accessible and perfectly rendered whether you’re on a desktop, tablet, or smartphone. This adaptability ensures that you can analyze and react to market movements no matter where you are.

Incorporating Other Technical Indicators

Understanding the Synergy

Bollinger Bands have been pivotal for traders trying to gauge price volatility. When integrated into TradingView, a leading charting platform, Bollinger Bands are even more potent. But the real magic happens when traders overlay other technical indicators on the bollinger bands tradingview chart. This not only provides a more in-depth analysis but also presents trading signals that might otherwise be overlooked.

Popular Technical Indicators to Pair with Bollinger Bands on TradingView

  1. Relative Strength Index (RSI): By adding RSI to the bollinger bands tradingview chart, traders can pinpoint potential overbought or oversold conditions. When Bollinger Bands indicate a volatility squeeze, and the RSI reads over 70 (overbought) or under 30 (oversold), it might signal an impending price reversal.
  2. Moving Averages: When used alongside the bollinger bands tradingview, moving averages (like the 50-day or 200-day MA) can highlight potential support and resistance levels. For instance, a price touch to the upper Bollinger Band combined with resistance from a moving average could be a strong sell signal.
  3. MACD (Moving Average Convergence Divergence): Incorporating MACD with bollinger bands tradingview helps traders recognize potential momentum shifts. When the MACD line crosses above its signal line and the price touches the upper Bollinger Band, it could indicate a robust bullish momentum. Conversely, a MACD line crossing below its signal line, combined with a price touch to the lower Bollinger Band, might imply a bearish momentum.

Fine-tuning the Visual Experience

The beauty of bollinger bands tradingview is the platform’s customization. Traders can adjust the opacity, colors, and widths of their Bollinger Bands and other technical indicators. This ensures that their chart remains clutter-free, emphasizing only the most crucial data points.

The Role of the TradingView Community

While bollinger bands tradingview offers a powerful visualization tool, the TradingView community serves as a knowledge reservoir. Here, traders share their custom strategies, incorporating Bollinger Bands with other technical indicators. By engaging with this community, traders can learn novel ways to maximize the potential of bollinger bands tradingview, refining their strategies based on shared experiences.

Advanced Features for Bollinger Bands Users on TradingView

1. Customized Alert Systems

A distinct advantage of using bollinger bands tradingview is the platform’s intricate alert system. Traders can set up specific notifications based on the movements or breaches of the Bollinger Bands. Imagine being informed instantly when the price touches the upper or lower band, allowing immediate action. This alert system ensures that traders never miss out on potential trading opportunities and can respond to market shifts proactively.

2. Enhanced Visualization Tools

Bollinger bands tradingview is not just about tracking the bands’ movements. The platform offers a suite of visualization tools that can be customized to suit a trader’s unique style. Whether it’s adjusting the thickness of the bands, changing their colors for better differentiation, or overlaying them on different types of charts like candlestick or line graphs, TradingView has it covered. Such visual enhancements can make the difference between a good trading decision and a great one.

3. Comprehensive Backtesting Capabilities

One of the cornerstones of a successful trading strategy is the ability to test its effectiveness. With bollinger bands tradingview, users can employ the platform’s backtesting tools to apply their Bollinger Bands strategies on historical data. This allows traders to gauge how their strategy would have performed in past market conditions and refine it further before real-time implementation. Backtesting, combined with the visual prowess of TradingView, can give traders the confidence to commit to their strategies.

4. Interactive Community Engagement

While the bollinger bands tradingview integration offers numerous tools for individual analysis, there’s also a vibrant community behind it. Engaging with this community can open doors to a plethora of strategies and insights. Interacting with experts who often use Bollinger Bands on TradingView can lead to productive discussions, allowing traders to refine and enhance their approach further. The community’s shared charts and insights make it a goldmine for continuous learning.

5. Scripting and Custom Indicators

Advanced traders often desire to go beyond the standard offerings. TradingView understands this and allows users to create custom scripts. When focusing on bollinger bands tradingview, traders can integrate their coded strategies, tailor the bands according to specific algorithms, or even create entirely new indicators derived from Bollinger Bands principles. This degree of customization is unparalleled and caters to the unique needs of professional traders.

6. Multi-Timeframe Analysis

When evaluating the effectiveness of Bollinger Bands, analyzing them across multiple timeframes can provide a broader perspective. With bollinger bands tradingview, transitioning between different timeframes – from minutes to days – is seamless. This multi-timeframe analysis ensures that traders are not just fixated on one aspect but have a holistic view of the market’s potential movements.

Safety and Security on TradingView

Why Safety and Security Matters on TradingView

TradingView is not just any platform; it’s a hub where traders from all walks of life converge, sharing insights, discussing strategies, and reviewing market conditions. As traders often engage in discussions on topics like bollinger bands tradingview, they might also inadvertently share snippets of their trading habits, routines, and sometimes, even their portfolio distribution. In such an environment, it becomes crucial that the platform ensures a robust line of defense against potential data breaches or cyber threats.

The Layers of Security on TradingView

  1. Data Encryption: TradingView uses advanced encryption protocols to ensure that user data, be it about bollinger bands tradingview discussions or personal trading strategies, remains confidential. This encryption extends to both data at rest and data in transit.
  2. Two-Factor Authentication (2FA): An added layer of security, 2FA requires users to provide two forms of identification before accessing their accounts. This process is especially relevant for those engaging in in-depth discussions about tools like bollinger bands tradingview, ensuring that their account remains accessible only to them.
  3. Regular Security Audits: TradingView conducts periodic security audits to identify potential vulnerabilities. By always being on the lookout for weak points and potential threats, especially in high-traffic areas like bollinger bands tradingview discussions, the platform ensures a proactive approach to user safety.
  4. Privacy Settings: Users have the flexibility to customize their privacy settings. If someone is frequently discussing tools and strategies, such as bollinger bands tradingview, they can choose who sees their posts, charts, and comments.

Trading Safely: User Responsibilities

While TradingView goes to great lengths to secure user data and provide a safe environment, especially for popular features like bollinger bands tradingview, users must also practice safety. This includes not sharing sensitive account details, ensuring they log out from shared devices, and being wary of phishing attempts or suspicious links.

The Bollinger Bands TradingView Feature and Security Implications

Given the immense popularity of the bollinger bands tradingview feature, it’s understandable that it becomes a focal point for discussions and interactions. Users need to ensure that while they delve deep into the technicalities and strategies surrounding Bollinger Bands, they remain cautious about not oversharing specifics of their trades or investments.

Conclusion

The synthesis of Bollinger Bands and TradingView offers traders a potent combination, marrying analysis with visualization. As markets continuously evolve, so should traders. And platforms like TradingView, especially with features like “bollinger bands tradingview”, ensure that traders are always one step ahead. Happy trading!

MT5 Strategy Tester Spread: Unveiling Its Impact on Trading Simulations

MT5 Strategy Tester Spread

Introduction

Forex trading has experienced a revolution with the introduction and continuous evolution of platforms like MT5. Amidst its multitude of features, one element that holds considerable weight is the spread. This article delves deep into the MT5 strategy tester spread and its ramifications on simulated trading.

Defining Spread in the Context of MT5

Every trader, novice or expert, comes across the concept of “spread.” In essence, it’s the difference between the buy and sell price of a currency pair. But, when it comes to strategy testing on platforms like MT5, the spread’s representation becomes even more critical. The MT5 strategy tester spread offers traders the capability to incorporate this vital component, ensuring simulations mirror real-world conditions. Correctly accounting for spread is the key to accurate and realistic trading simulations.

MT5 Strategy Tester Spread Mechanics

By default, the MT5 strategy tester provides a predefined spread setting, which acts as a general placeholder for backtesting. However, the real market doesn’t operate on fixed spreads – it has its moments of variability influenced by numerous factors. Recognizing the distinction between fixed and variable spreads becomes fundamental in understanding the MT5 strategy tester spread mechanics. Especially during volatile market conditions, the spread can fluctuate widely, and this dynamic is crucial to capture within strategy testing.

Importance of Accurate Spread Settings in Backtesting

  1. Defining the Landscape: Spread in Forex TradingSpread, the difference between the buying and selling price of a currency pair, acts as a vital factor in determining trading profitability. With the fluctuating nature of spreads in real markets, ensuring that your backtesting environment closely mirrors these fluctuations is critical. This is where the mt5 strategy tester spread comes into play, offering traders the capability to integrate accurate spread settings for more realistic simulations.
  2. The Risk of MisrepresentationIgnoring or misrepresenting spread during backtesting can lead to a dangerously skewed perception of a strategy’s viability. A strategy might appear profoundly profitable when tested with an inaccurately tight spread. However, when confronted with the reality of wider spreads in live trading, that same strategy might crumble. By utilizing the mt5 strategy tester spread, traders can prevent such unpleasant surprises, ensuring their strategies are primed for real-world conditions.
  3. MT5’s Advanced Spread Setting ToolsRecognizing the crucial role of spread in backtesting, the MT5 platform offers advanced tools and features dedicated to spread settings. The mt5 strategy tester spread allows traders to adjust and customize spread values, ensuring that backtests run under conditions that closely resemble real market scenarios. Whether it’s the representation of variable spreads that change with market volatility or using historical spread data, MT5’s strategy tester is adequately equipped.
  4. Enhanced Decision MakingAccurate representation using the mt5 strategy tester spread provides traders with a clearer picture of potential pitfalls, challenges, and opportunities their strategy might encounter. By understanding how spread fluctuations impact strategy performance, traders can make more informed decisions, tweaking and optimizing their strategy for maximum efficiency.
  5. Building Robust StrategiesA strategy that only performs well under a specific, narrow spread setting might not be resilient enough for the volatile forex market. Using the mt5 strategy tester spread to test strategies across a range of spread scenarios ensures the creation of robust trading systems. These systems are not only adaptable to different market conditions but are also resilient against unexpected spread expansions that might occur due to geopolitical events or major economic announcements.
  6. Cost Implications and ProfitabilityAccurate spread settings in backtesting also provide clarity on trading cost implications. The spread constitutes a direct cost for traders, and by using the mt5 strategy tester spread effectively, one can gauge the potential costs of trading and subsequently the net profitability of a strategy. This clarity can be instrumental in choosing which strategy to deploy and when.

Customizing Spread in MT5 Strategy Tester

Why the Emphasis on MT5 Tester Spread Customization?

Forex trading inherently deals with spreads—the difference between bid and ask prices. While live markets experience variable spreads based on liquidity, news events, and time of day, many backtesting environments often default to a fixed spread, which doesn’t always replicate real market conditions. The MT5 strategy tester spread customization tools allow for a more nuanced approach, letting traders adjust spread values to mirror historical or anticipated market conditions.

Accessing Spread Settings in MT5 Strategy Tester

Upon launching the MT5 strategy tester, one will find options to input various parameters for testing, including the spread. By default, this might be set to a current or average spread, but it’s in this arena that the MT5 strategy tester spread truly offers its customization prowess. Traders can manually input a fixed spread or choose to integrate variable spread data.

Simulating Real-World Conditions with Variable Spreads

While fixed spreads simplify backtesting, they don’t necessarily replicate the ebbs and flows of the market. For traders aiming to achieve maximum realism in their simulations, the MT5 strategy tester spread tools allow the incorporation of historical spread data. This data can be sourced from brokers or third-party providers, ensuring that the strategy undergoes testing under conditions that mirror actual market fluctuations. Such meticulous testing aids in creating strategies that are resilient to spread volatility.

Benefits of Customizing the MT5  Tester Spread

  1. Accuracy: By using an accurate spread, traders can avoid the pitfalls of overestimation. An unrealistically tight spread might paint a rosier picture than what one might experience in live trading. By customizing the MT5  tester spread, traders get a more genuine performance picture.
  2. Strategy Refinement: Different strategies react differently to spread variations. Scalping strategies, for instance, are highly sensitive to even minor spread changes. Customizing spread ensures that these strategies are tested under realistic constraints.
  3. Risk Management: A significant part of trading success is managing potential risks. By understanding how different spread scenarios impact a strategy via the MT5 tester spread, traders can develop better risk management protocols.

Advanced Features and Continuous Updates

The MT5 platform, in its commitment to providing top-notch trading tools, regularly updates its features. The MT5 strategy tester spread settings are no exception. With every update, there might be enhanced functionalities or more straightforward interfaces allowing traders even more nuanced control over their spread settings.

MT5  Tester Spread and Scalping Strategies

Scalping strategies are largely influenced by the spread, which can significantly impact the profitability of trades. For scalping to be successful, it often necessitates low spreads. This is because scalpers operate on thin margins and higher spreads can quickly erode the profits from such trades. Utilizing the MT5 strategy tester spread settings, scalpers can create a simulated trading environment that mirrors the real-time spread conditions, allowing them to assess the potential viability of their strategies accurately.

As we delve deeper, we find that the MT5 strategy tester spread isn’t merely a tool; it’s an analytical powerhouse, designed to mimic real-world market conditions closely. It helps scalpers decipher the intricate dance of numbers with precision and agility. By replicating various spread scenarios, it provides traders with insights that are crucial to formulating strategies which can withstand the fast-paced and sometimes unpredictable nature of scalping trades.

A noteworthy feature of the MT5 strategy tester spread is its ability to facilitate customization. Traders can modify the spread settings to reflect both fixed and variable spreads, allowing for a comprehensive analysis of how different spread scenarios affect scalping strategies. For instance, by testing strategies under conditions of higher spread, traders can determine the thresholds beyond which their strategies are no longer profitable. This insight is vital in setting appropriate risk management rules and making informed decisions in real-time trading.

Furthermore, the MT5 tester spread offers a visual mode, providing traders with a graphical representation of how spread fluctuations influence their trades. This can be an enlightening experience, particularly for scalpers who operate in timeframes where every tick can be the difference between profit and loss. The visual representation not only aids in understanding the immediate impact of spread on trades but also helps in fine-tuning strategies to better adapt to changing market conditions.

With scalping, traders need to be well versed with not only the entry points but also with efficient exit strategies. The MT5 tester spread facilitates this by allowing traders to scrutinize the impact of spread on both their entry and exit points. By simulating various spread conditions, it helps in crafting strategies that can proficiently navigate the choppy waters that scalping sometimes involves.

But the role of MT5  tester spread doesn’t stop at strategy formulation; it extends to ongoing strategy refinement as well. As market conditions evolve, it becomes imperative for traders to continually adapt and modify their strategies. The MT5  tester spread stands as a reliable ally in this, offering traders the means to test the resilience and adaptability of their strategies across different market conditions, ensuring that they remain viable in the long run.

Analyzing MT5 Tester Reports with a Focus on Spread

Understanding the Basics

At the core of every MT5 strategy tester report lies a wealth of information. These reports detail every aspect of a strategy’s performance during the backtesting phase. While parameters like profit, drawdown, and win rate catch immediate attention, it’s imperative to focus on the MT5 strategy tester spread. This figure, often nestled amidst other data, showcases the direct impact of spread on a strategy’s results.

Why Spread Matters

Spread represents the difference between the bid and the ask price of a currency pair. Even minor fluctuations in spread can have pronounced effects, especially in strategies that rely on small profit margins, such as scalping. Recognizing the influence of the MT5 strategy tester spread on overall performance can offer a more grounded perspective on a strategy’s viability in real market conditions.

Dissecting the Spread Cost

Within the MT5 strategy tester report, the spread cost emerges as a pivotal metric. It’s a direct representation of the cost incurred due to the spread throughout the backtesting phase. By evaluating the MT5 strategy tester spread cost, traders can ascertain how much of their potential profit (or increased loss) was due to the spread. In essence, this metric provides clarity on whether the strategy’s gains are substantial or if they could be eroded by real-world spread conditions.

Comparative Analysis with Different Spreads

MT5 allows traders to adjust spread settings when backtesting. A diligent trader can run multiple tests using varying spread conditions, ranging from optimal to worst-case scenarios. By analyzing each corresponding MT5 strategy tester spread in reports, one can gauge a strategy’s sensitivity to spread fluctuations. If a strategy remains profitable across a wide spread range, it showcases its robustness. Conversely, if performance deteriorates with slight spread adjustments, it might warrant strategy optimization or reconsideration.

Contextualizing Spread within Overall Performance

The MT5 tester spread shouldn’t be assessed in isolation. It’s essential to contextualize its impact by looking at other metrics in the report. For instance, if a strategy has high profitability with a corresponding high spread cost, it indicates that the strategy can absorb spread fluctuations. However, if the net profit is only marginally higher than the spread cost, the strategy may be at risk during volatile market periods with erratic spreads.

Ensuring Robustness in Strategy Testing Considering Spread

Understanding the Intricacies of Spread in Testing

Spread, the difference between the buy and sell price of a currency pair, isn’t static. It varies depending on numerous factors like market liquidity, volatility, and time of day. When backtesting strategies, it’s easy to oversimplify this aspect and use a fixed spread. However, doing so can lead to misleading results. The MT5 strategy tester spread capability recognizes this dynamic nature, allowing traders to factor in variable spreads in their testing for a more accurate representation.

Potential Pitfalls of Ignoring Spread Dynamics

By not adequately accounting for the spread’s variability, traders can fall into several traps. For instance, a strategy might appear profitable during periods of low spread but can lead to losses when the spread widens. Conversely, strategies optimized for higher spreads might underperform in tighter spread scenarios. The MT5 strategy tester spread offers the means to circumnavigate these pitfalls, allowing traders to test their strategies across a spectrum of spread scenarios.

Strategies’ Sensitivity to Spread

Certain strategies, especially those that bank on thin profit margins like scalping, are incredibly sensitive to spread variations. Even minor misjudgments in spread during backtesting can drastically skew results, leading to overconfidence in an otherwise flawed strategy. The MT5 strategy tester spread becomes an invaluable tool here. It ensures that such strategies are not just viable under specific spread conditions but have the robustness to navigate the ever-changing spread landscapes of live markets.

Optimizing Without Over-Optimizing

While the MT5 strategy tester spread capabilities are powerful, there’s a caveat every trader must be wary of – over-optimization. It’s crucial to strike a balance. On one hand, a strategy should be optimized to handle different spread scenarios, but on the other, it shouldn’t be so tailored that it only works for a specific past dataset and fails in real-time trading. The MT5 strategy tester spread features, when used judiciously, can help find this balance, ensuring strategies are adaptable yet not overfitted.

Repetitive Testing Across Spread Scenarios

To ensure robustness, repetitive testing is a must. The MT5  tester spread allows traders to simulate various spread scenarios, from extremely tight to exceptionally wide spreads. By repeatedly testing a strategy across these scenarios, traders can pinpoint its strengths and vulnerabilities. This repetitive testing ensures that the strategy is resilient, not just to the market’s inherent unpredictability but also to the spread’s fluctuations.

Continuous Adaptation: Keeping Up with MT5 Spread Settings Updates

The mt5 strategy tester spread is a testament to how even seemingly minute details can have significant impacts on strategy testing outcomes. As such, the onus is on traders to ensure that their spread settings within the strategy tester align with the latest standards and best practices provided by the platform.

1. Periodic Review of MT5 Updates:
Every platform, including MT5, rolls out updates that may introduce new features, optimize existing ones, or correct previous anomalies. Traders must maintain a regular schedule to check for updates that pertain to the mt5 tester spread. Ignoring such updates might result in using outdated spread settings, leading to inaccurate backtesting results.

2. Understanding the Essence of Spread Updates:
Updates to the mt5 strategy tester spread aren’t arbitrary. They’re often a reflection of the evolving market conditions or improved algorithms to better simulate real-world trading. By understanding the rationale behind each update, traders can better contextualize their backtesting results and make more informed decisions.

3. Embracing Flexibility in Strategy Testing:
Just as the mt5 strategy tester spread evolves, so should traders’ approaches to backtesting. If a particular spread setting has been used historically, and a new update offers enhanced features, traders must be open to re-evaluating their strategies under these new conditions. Such an approach ensures that strategies remain relevant and viable.

4. Engaging with the MT5 Community:
The MetaTrader community is vast, comprising traders, developers, and enthusiasts. Engaging with this community can provide insights into the latest best practices related to the mt5 strategy tester spread. Forums, webinars, and discussions often touch upon nuances that may not be immediately evident from official update logs.

5. Documenting Changes and Results:
Every time there’s a modification in the mt5 strategy tester spread, traders should document the changes and the resulting backtest outcomes. This documentation offers a historical perspective, enabling traders to understand the trajectory of their strategies in light of the evolving spread settings.

6. Being Proactive, Not Reactive:
Lastly, a proactive approach towards updates, especially concerning the mt5 strategy tester spread, is essential. Instead of waiting for noticeable discrepancies in backtest results, regularly checking and adapting to the latest spread settings can prevent potential pitfalls.

Conclusion

The MT5 strategy tester spread isn’t just another feature; it’s a cornerstone for accurate trading simulations. As traders tread the intricate landscapes of forex markets, tools like the MT5 strategy tester spread act as their compass, guiding them towards informed decisions. As with all trading tools, understanding and effectively leveraging them is the path to success. The MT5 strategy tester spread is no exception and deserves every trader’s attention and mastery.

Bollinger Bands Strategy: A Comprehensive Guide for Forex Traders

Forex trading is a vast field, where success often hinges on the adept use of technical analysis tools. Among these tools, the Bollinger Bands stand out as a crucial resource for traders. In this article, we delve deep into the bollinger bands strategy, understanding its nuances, benefits, and how to effectively employ it in your trading endeavors.

Understanding Bollinger Bands

At its core, the Bollinger Bands strategy revolves around three primary bands. These are the Middle Band, Upper Band, and Lower Band. These bands represent moving averages and standard deviations, which provide insights into potential price movements.

The Middle Band is essentially a simple moving average, generally defaulting to 20 periods. Surrounding this Middle Band are the Upper and Lower Bands, which signify the standard deviations from the moving average. Essentially, these bands expand and contract based on market volatility.

Setting up Bollinger Bands

1. The Basics of Bollinger Bands

Bollinger Bands consist of three primary lines: the Middle Band (a simple moving average), and two outer bands (Upper and Lower Bands) which act as the standard deviations. The primary objective of the bollinger bands strategy is to monitor the distance between these bands, indicating market volatility.

2. Selection of Period

The foundation of this strategy is the moving average, often defaulting to a 20-period setting. However, the selection of the period is crucial. Some traders adjust this default setting based on their market observations and strategy. A shorter period might be more responsive to price changes, while a longer period might offer a smoother overview.

3. Determining Standard Deviation

Standard deviation plays a pivotal role in the bollinger bands strategy. Typically set at 2, the standard deviation determines the distance of the Upper and Lower Bands from the Middle Band. A higher deviation means wider bands, suggesting more volatility, whereas narrower bands (with a lower deviation) indicate less volatility.

4. Platform Setup

For executing the bollinger bands strategy efficiently, traders need to integrate Bollinger Bands on their preferred trading platforms. Most modern platforms, whether MetaTrader or Thinkorswim, offer Bollinger Bands as a built-in indicator. Accessing the indicator settings allows users to adjust the period and standard deviation in line with their bollinger bands strategy.

5. Visual Customization

The beauty of the bollinger bands strategy is not just in its effectiveness but also in its adaptability. On most trading platforms, traders can customize the visual appearance of the bands – adjusting their color, thickness, or style. While this doesn’t influence the strategy’s efficiency, it aids in better visual interpretation, especially when multiple indicators are at play.

6. Pairing with Other Indicators

Although Bollinger Bands are powerful on their own, their efficacy in the bollinger bands strategy can be enhanced when paired with other indicators. For example, integrating the Relative Strength Index (RSI) can help pinpoint overbought or oversold conditions, ensuring that traders don’t misinterpret signals solely based on the bands.

7. Continuous Monitoring and Adjustments

The world of trading is dynamic. As such, what worked today might not be as effective tomorrow. Thus, an essential aspect of the bollinger bands strategy is continuously monitoring and adjusting the settings. The markets evolve, and so should your strategies

Key Concepts Related to Bollinger Bands Strategy

1. The Three Bands

Central to the bollinger bands strategy are three distinctive bands:

  • Middle Band: This is the heart of the strategy. Essentially a simple moving average, it typically defaults to a 20-period average. However, traders can adjust this period based on their preferences and the specificities of the assets they’re trading.
  • Upper and Lower Bands: These represent volatility in the market. They’re determined by adding and subtracting a standard deviation from the middle band. The nature of these bands is dynamic; they widen during periods of increased volatility and contract during more stable times. Their behavior plays a pivotal role in the bollinger bands strategy.

2. Bollinger Bounce

A foundational concept in the bollinger bands strategy, the Bollinger Bounce refers to the tendency of prices to “bounce” off the upper and lower bands. It’s an embodiment of the market’s cyclical nature. When prices touch or break through the upper band, it often indicates that the asset might be overbought. Conversely, if the prices graze the lower band, it could hint at the asset being oversold. Traders using the bollinger bands strategy monitor these touches closely as potential signals for entry or exit points.

3. Bollinger Squeeze

The Bollinger Squeeze is another cornerstone of the bollinger bands strategy. It occurs when the bands come close together, signaling a period of low volatility. For traders, this squeeze is like the calm before the storm, often indicating a major price move on the horizon. Recognizing the squeeze in real-time and predicting the subsequent direction of the breakout can be the difference between a successful trade and a missed opportunity.

4. Combining with Other Indicators

While the bollinger bands strategy is robust in its own right, its strength can be magnified when used in conjunction with other technical indicators. For instance, combining the strategy with the Relative Strength Index (RSI) can offer deeper insights into potential overbought or oversold conditions, enhancing the predictive power of the bollinger bands strategy.

5. The Role of Market Volatility

At its core, the bollinger bands strategy is a reflection of market volatility. The bands’ behavior—whether they’re contracting or expanding—offers traders a window into the market’s current temperament. This insight can be pivotal in timing trades and setting stop-loss or take-profit points.

Common Mistakes to Avoid

  1. Sole Reliance on Bollinger Bands: One of the primary mistakes traders make is relying solely on the Bollinger Bands strategy for decision-making. While Bollinger Bands can be a powerful indicator of price movements and potential reversals, using it in isolation can often result in a skewed perspective. It’s always prudent to complement this strategy with other technical indicators like the Moving Average Convergence Divergence (MACD) or the Relative Strength Index (RSI) for a more holistic view of the market.
  2. Misinterpreting the Bands’ Expansion and Contraction: A fundamental aspect of this strategy is the interpretation of the bands’ movements. Many novice traders mistake the bands’ contraction (squeeze) as an immediate buy or sell signal, expecting a major price move. While the squeeze can indeed indicate potential volatility, determining the direction of the breakout is crucial. Similarly, just because the bands are expanding doesn’t mean the price will maintain its current direction.
  3. Ignoring the Middle Band: The focus often remains on the upper and lower bands, but the middle band, representing the simple moving average, is equally significant in the Bollinger Bands strategy. Overlooking the middle band can mean missing out on crucial trend reversal indications. A price crossing the middle band can sometimes be an early sign of a trend change, especially if other indicators support this movement.
  4. Overestimating Overbought and Oversold Conditions: When prices consistently touch or surpass the upper band, the asset may be considered overbought, and when they touch the lower band, it might be seen as oversold. However, in a strong trending market, prices can remain overbought or oversold for extended periods. Blindly shorting an overbought market or buying an oversold one without considering the broader trend can be detrimental to the trading portfolio.
  5. Setting Inflexible Parameters: The default setting for Bollinger Bands is a 20-day moving average with a 2 standard deviation for the upper and lower bands. While this might work for many scenarios, sticking rigidly to these parameters without adapting to the market can be a mistake. The Bollinger Bands strategy is flexible, and traders should feel comfortable adjusting these settings to better fit the asset or timeframe they are trading.
  6. Neglecting the Broader Market Context: While Bollinger Bands can provide insights into potential price actions, it’s essential to understand the broader market context. Factors like major news events, economic announcements, and other macro indicators can influence price movements beyond what’s predicted by Bollinger Bands.

Benefits of Using Bollinger Bands

The forex trading landscape is teeming with tools and strategies designed to give traders an edge in predicting market movements. Among these, the Bollinger Bands have emerged as an immensely popular and versatile tool. By understanding the advantages of implementing this strategy, traders can make more informed decisions and potentially enjoy greater profitability. Let’s delve deeper into the benefits of this esteemed strategy.

1. Clear Identification of Overbought and Oversold Markets

One of the primary advantages of this strategy is its ability to highlight overbought and oversold conditions in the market. When the price of a currency pair touches or exceeds the upper band, it often indicates an overbought condition. Conversely, when it touches or drops below the lower band, the market could be oversold. By keeping an eye on these movements, traders using the bollinger bands strategy can identify potential reversal points and make trades accordingly.

2. Recognition of Volatility Shifts

Volatility is a crucial factor in the forex market, influencing the potential profit and risk associated with trades. The strategy provides clear visual cues about volatility shifts. When the bands contract, it indicates a period of low volatility, while band expansion signifies increased volatility. By recognizing these patterns, traders can adjust their strategies to either capitalize on or protect themselves from potential market swings.

3. Versatility Across Timeframes

Whether you’re a scalper working with minute charts or a long-term trader analyzing weekly data, the bollinger bands strategy can be applied effectively. This adaptability makes it a versatile tool suitable for various trading styles and strategies.

4. Improved Risk Management

By offering insights into potential price reversals and volatility shifts, the bollinger bands strategy can assist traders in setting more accurate stop-loss and take-profit levels. When combined with other technical analysis tools, it can further refine entry and exit points, thereby enhancing a trader’s risk management capabilities.

5. Detection of Continuation and Breakout Patterns

The ‘Bollinger Squeeze’, a central component of the  strategy, is a potent pattern that signals potential breakouts. When the bands come close together, indicating reduced volatility, a subsequent expansion can signal the beginning of a significant price movement. Recognizing this early can provide traders with lucrative trading opportunities.

6. Enhanced Decision Making with Complementary Indicators

While the strategy is powerful on its own, its efficacy can be further enhanced when used in tandem with other indicators. For instance, combining Bollinger Bands with the Relative Strength Index (RSI) can help in confirming overbought or oversold signals, providing traders with an added layer of confidence in their decisions.

7. Aiding in Trend Identification

In the forex market, understanding the direction and strength of a trend can be the difference between profit and loss. The positioning of price in relation to the bands can give insights into potential trend continuations or reversals. If the price remains near the upper band while traveling across, it could indicate a strong uptrend. Conversely, if it hovers near the lower band, a downtrend might be in play.

Limitations and Cautions

  1. False Breakouts: One of the common pitfalls of the Bollinger Bands strategy is the occurrence of false breakouts. There are times when the price seems to break through the upper or lower band, suggesting a potential trend, only to revert back into the band’s range. Relying solely on band breakouts without considering other indicators can result in misguided trading decisions.
  2. Overreliance on Bands for Predictions: The Bollinger Bands strategy revolves around the principle of mean reversion, assuming that prices will always revert to the mean (middle band) over time. However, during strong trending markets, prices can “ride” the bands for extended periods. An overreliance on the strategy in such scenarios might lead to missed profitable opportunities or potential losses.
  3. Static Standard Deviation: The Bollinger Bands strategy uses a static number for the standard deviation, usually set at two. This assumes that price movements conform to a normal distribution, which isn’t always the case in real-world trading. Sometimes, significant news events or market sentiment shifts can lead to price movements that don’t align with the standard statistical assumptions of the Bollinger Bands strategy.
  4. Misinterpreting Band Contraction: A contraction or “squeeze” of the bands indicates decreasing volatility and is often viewed as a precursor to a potential breakout. However, the Bollinger Bands strategy does not specify the direction of this breakout. Traders might anticipate a bullish breakout when, in reality, a bearish reversal is on the horizon, and vice versa.
  5. Delay in Indications: Like many technical indicators, the Bollinger Bands strategy can sometimes lag behind real-time price movements. By the time the bands indicate a buy or sell signal, the optimal entry point might have passed.

Precautions to Take:

  1. Combine with Other Indicators: To offset the limitations of the Bollinger Bands strategy, it’s wise to combine it with other technical analysis tools. For instance, integrating momentum indicators like the Relative Strength Index (RSI) can help distinguish between genuine and false breakouts.
  2. Stay Updated: Ensure you stay updated with global news and market shifts. Sometimes, external events can drastically influence price movements, rendering technical indicators less effective.
  3. Practice Makes Perfect: Before implementing the Bollinger Bands strategy in live trading, practice with a demo account. It gives you a feel of how the bands react to price movements and helps you develop a more intuitive understanding.
  4. Stay Flexible: The Bollinger Bands strategy, while robust, should not be seen as infallible. It’s essential to remain flexible in your approach, adjusting and recalibrating your strategy as market conditions change.
Bollinger Bands Strategy

Enhancing the Bollinger Strategy

Forex trading has seen a surge in the use of technical indicators, and one of the most prevalent is the bollinger bands strategy. This strategy offers traders a visual representation of price volatility and potential overbought or oversold conditions. But while the bollinger strategy is powerful on its own, its potential can be amplified when integrated with other technical tools and approaches.

1. Integrating with Other Technical Indicators

  • Relative Strength Index (RSI): RSI is a momentum oscillator that measures the speed and change of price movements. When combined with the bollinger bands strategy, traders can identify more clear-cut overbought or oversold conditions. For instance, if the price touches the upper band while the RSI indicates an overbought condition, it might signal a potential price reversal.
  • Moving Average Convergence Divergence (MACD): This trend-following momentum indicator shows the relationship between two moving averages of a security’s price. By using MACD alongside the bollinger bands strategy, traders can confirm potential buy or sell signals. If the MACD shows a rising trend while the price is near the lower band, it might be a strong buy signal.

2. Using Multiple Time Frame Analysis

While the bollinger bands strategy can be applied on any time frame, utilizing multiple time frames can provide a broader view of the market. For instance, if a trader identifies a buy signal on a daily chart using the bollinger bands strategy, checking the weekly or monthly chart can confirm the long-term trend direction. This layered approach ensures that traders are in sync with both short-term and long-term market movements.

3. Incorporating Price Patterns

Patterns like double tops, double bottoms, triangles, and flags often appear within the Bollinger Bands. Recognizing these patterns within the context of the bollinger bands strategy can provide traders with added confirmation. For instance, a double bottom pattern near the lower band could reinforce a potential buy signal.

4. Adapting to Market Volatility

The nature of this strategy is such that the bands expand during periods of high volatility and contract during low volatility. By adjusting the standard deviation settings, traders can make the bands more responsive or less responsive to price volatility. This customization allows traders to adapt the bollinger bands strategy to different market conditions.

5. Diversifying with Different Assets

The bollinger bands strategy isn’t limited to forex trading. It can be applied to stocks, commodities, and other financial instruments. By diversifying their portfolio and applying the bollinger bands strategy across different assets, traders can spread risk and identify a wider range of trading opportunities.

Conclusion

In the vast world of forex trading, understanding and effectively employing the bollinger bands strategy can be a game-changer. By grasping its intricacies and combining it with other technical indicators, traders can chart a more informed and potentially profitable trading journey. Like all tools, the key lies not just in understanding its mechanics but in effective and informed application.

Forex Trading Plan for Beginners: Transitioning to a Live Account Successfully

Forex trading plan for beginners

Introduction

Trading in the Forex market without a plan is akin to sailing in the open ocean without a compass. Every experienced trader knows the importance of having a structured trading plan. It’s not merely about predicting market movements; it’s about systematic preparation, risk management, and maintaining discipline. Particularly for newcomers, the Forex trading plan for beginners serves as the critical roadmap directing every trade.

Forex Market Overview

The Forex or foreign exchange market stands as the world’s largest financial market. Operating 24 hours a day, it offers traders the flexibility to engage in trading sessions across different time zones. Major currency pairs, such as EUR/USD or GBP/JPY, hold significant sway in the market. For beginners, understanding these pairs and the implications of different time zones is crucial in constructing a trading plan.

The Foundation: Understanding Yourself

Before diving deep into the Forex market, you need to take a step back and understand yourself. A Forex trading plan for beginners should begin with a clear self-assessment. This introspection includes recognizing your financial aspirations, your risk appetite, and how emotionally prepared you are for the volatility of trading. The psychological dimension of trading can be as impactful as understanding the market itself.

Key Elements of a Forex Trading Plan

Trading in the foreign exchange market, often referred to as Forex, demands more than intuition or luck. A structured approach is essential, especially for those who are new to the realm. Crafting a Forex trading plan for beginners should not be taken lightly; it provides the scaffold upon which all your trading decisions should be based. Here, we delve deeper into the key elements that form the backbone of an effective trading plan, ensuring that every beginner trader is well-prepared to face the market’s challenges.

1. Clearly Defined Objectives

The starting point of any Forex trading plan for beginners is the determination of what you aim to achieve. Setting objectives gives your trading journey a direction and purpose. Do you want short-term gains, or are you looking at Forex trading as a long-term investment? Your trading frequency, strategies, and risk tolerance will all be influenced by the goals you set out at this initial stage.

2. Entry and Exit Rules

For someone crafting their first Forex trading plan for beginners, it might be tempting to jump into trades based on gut feelings. However, seasoned traders understand the value of predetermined entry and exit rules. By setting clear criteria for when to initiate or close a trade, you reduce the role of emotion in your trading decisions. It’s about having a systematic approach, where you know when to get in, and more importantly, when to get out.

3. Risk Management Protocols

Risk is inherent to trading, more so in a market as volatile as Forex. An effective ”Forex trading plan for beginners” must have concrete risk management strategies. These include determining in advance how much of your capital you are willing to risk per trade, setting stop-loss orders to limit potential losses, and deciding on a risk-to-reward ratio that aligns with your personal comfort level.

4. Trading Schedule

The Forex market operates 24 hours a day, but that doesn’t mean you should be trading round the clock. A structured Forex trading plan for beginners will delineate specific times dedicated to market research, analysis, and actual trading. This not only ensures you’re trading efficiently but also helps in maintaining a work-life balance.

5. Continuous Learning

The Forex market, with its dynamic nature, demands constant learning. In your Forex trading plan for beginners, set aside time for education. This could involve staying updated with global financial news, learning about new trading strategies, or understanding the implications of geopolitical events on currency values.

6. Performance Evaluation

Every Forex trading plan for beginners should incorporate a mechanism for performance tracking. By maintaining a detailed trading journal, you can review your trades, understand where you went right or wrong, and refine your strategies accordingly. It’s about iterative learning from both successes and failures.

7. Psychological Preparedness

Often overlooked but equally critical is the psychological aspect of trading. A comprehensive Forex trading plan for beginners will address this, helping new traders understand and manage the emotional highs and lows. From the fear of missing out (FOMO) to the thrill of a winning streak, being mentally prepared for these situations can be the difference between impulsive decisions and informed choices.

The Role of Technical and Fundamental Analysis

Entering the world of Forex can be both thrilling and daunting. With myriad factors affecting market movements and countless strategies available, it can easily overwhelm a novice trader. That’s where the importance of a solid Forex trading plan for beginners comes into play. At the heart of this plan are two pillars of market analysis – technical and fundamental. Together, they equip traders with the insights needed to make informed decisions in the fluctuating realm of currency trading.

1. Understanding Technical Analysis

Technical analysis is akin to the compass of a ship navigating the vast ocean of Forex trading. It predominantly revolves around studying past market data, primarily price and volume, to forecast future price movements.

How it fits into a Forex trading plan for beginners:

  • Chart Patterns and Indicators: For beginners, understanding charts can be the gateway to grasping the market’s pulse. Whether it’s candlestick patterns, trend lines, or moving averages, these visual tools help in identifying potential market trends.
  • Historical Data: The Forex market, like history, often repeats itself. By studying historical data, beginners can identify patterns that are likely to recur. This analysis can be an invaluable component of a Forex trading plan for beginners, guiding them on potential entry and exit points.
  • Risk Management: With technical analysis, beginners can set precise stop-loss and take-profit points. This precision is crucial in managing potential losses and maximizing gains.

2. Diving into Fundamental Analysis

While technical analysis offers a microscopic view of the market based on patterns and data, fundamental analysis zooms out to give a macro perspective. It involves understanding the larger events that shape the financial world.

Integrating it into a Forex trading plan for beginners:

  • Economic Indicators: For a newbie in Forex trading, keeping an eye on major economic announcements like GDP, inflation rates, and employment figures is essential. These indicators can significantly sway currency values, and hence, are integral to a Forex trading plan for beginners.
  • Geopolitical Events: The global political landscape can have a direct bearing on currency values. Whether it’s an election in a major economy or a geopolitical conflict, these events can result in substantial market volatility. A beginner’s trading plan should account for these variables.
  • Central Bank Decisions: Interest rate decisions, monetary policies, and other announcements from central banks can lead to dramatic shifts in Forex markets. For someone crafting a Forex trading plan for beginners, understanding the potential implications of these decisions is crucial.

Technical vs. Fundamental Analysis: Which One to Choose?

Both technical and fundamental analyses have their merits. While technical analysis can offer precise entry and exit points, fundamental analysis provides the broader context. A well-rounded Forex trading plan for beginners ideally integrates both. It allows the trader to have a holistic view of the market, combining the precision of technical tools with the broader understanding provided by fundamental insights.

Setting Up a Demo Account

A robust Forex trading plan for beginners should consider the utilization of a demo account as a priority. These demo accounts mirror the real trading platforms and provide beginners with a realistic, yet secure, environment to hone their skills. Let’s delve deeper into why setting up a demo account forms a crucial aspect in a Forex trading plan for beginners.

Understanding the Interface

A demo account is usually equipped with a similar interface as a live trading account. This means beginners get to acquaint themselves with various tools and features without the pressure of losing money. A significant part of a Forex trading plan for beginners is getting used to the trading platform’s functionalities, chart readings, order placements, and executing buy or sell orders. Being proficient with the interface can save valuable time and prevent costly errors in live trading.

Experimenting with Strategies

As part of the Forex trading plan for beginners, one must develop and experiment with different trading strategies. A demo account offers the perfect space for this experimentation. Beginners can try out different trading methods, analyze market trends, and understand the nuances of forex trading without any financial repercussions. It’s a safe space where they can learn, make mistakes, and grow without any financial risk.

Risk Management

Risk management is a cornerstone of any Forex trading plan for beginners. In a demo account, traders can practice setting stop-loss and take-profit levels, thus learning how to manage risks effectively. This kind of risk-free practice helps in building confidence and preparing beginners to manage their investments wisely when they transition to a live account.

Developing Psychological Resilience

Forex trading can be a roller-coaster of emotions, especially for newcomers. The process of setting up and using a demo account helps in developing the psychological resilience needed for live trading. As part of the Forex trading plan for beginners, learning to manage emotions such as fear, greed, and excitement is vital. A demo account helps in building this emotional steadiness by replicating the pressures of real trading without any actual financial risk involved.

Seamless Transition to Live Trading

Once beginners feel confident with their strategies and understanding of the market dynamics, transitioning to a live account becomes less daunting. The familiarity gained through the demo account usage eases this transition, making it a less stressful process. It’s a step that consolidates the learning and preparations made in the Forex trading plan for beginners, marking the initiation into the world of real forex trading.

Performance Tracking and Revision

The Essence of Performance Tracking in Forex

Performance tracking isn’t just about monitoring the profits or losses on trades. It’s a comprehensive approach to understanding the intricacies of your trading habits, strategies, and decisions. With a Forex trading plan for beginners, one isn’t merely learning about the market; they’re also learning about themselves as traders.

  • Understanding Trading Patterns: By monitoring trades, beginners can identify recurring patterns. Maybe there’s a specific time of day when their trades are more successful, or perhaps a particular currency pair consistently gives them trouble. Recognizing these patterns is an integral part of refining a Forex trading plan for beginners.
  • Emotional Reactions: Forex trading, especially for beginners, can be an emotional rollercoaster. Tracking performance includes documenting emotional states during trades. Was a trade made out of fear? Or maybe due to overconfidence after a few successful trades? By noting these emotions in conjunction with trading results, those new to Forex can begin to understand how emotions impact their trading decisions.

Revising the Forex Trading Plan for Beginners

Once there’s ample data from performance tracking, the next step in the Forex trading plan for beginners is revision. And this isn’t a one-time task; it’s a continual process.

  • Adjusting to Market Changes: Forex markets are dynamic. What worked a few months ago might not be as effective today. Beginners should be prepared to adjust their strategies based on both their performance data and the current state of the market.
  • Learning from Mistakes: Every trader, no matter how experienced, makes mistakes. However, the key is not to avoid errors entirely but to learn from them. By understanding where things went wrong and adjusting the Forex trading plan for beginners accordingly, new traders can turn setbacks into growth opportunities.
  • Incorporating New Knowledge: As beginners progress in their Forex journey, they will undoubtedly come across new strategies, tools, and perspectives. Performance tracking and revision give them the opportunity to incorporate this new knowledge into their trading plan, ensuring they’re always using the most updated and effective strategies.

The Iterative Nature of Trading

Forex trading is iterative. It’s a cycle of planning, executing, tracking, and revising. Especially when creating a Forex trading plan for beginners, understanding this iterative nature can help manage expectations. There will be periods of success, setbacks, learning, and growth. By consistently tracking performance and making necessary revisions, beginners position themselves not just for short-term gains but long-term success in the Forex market.

Transitioning to a Live Account

Understanding the Difference Between Demo and Live Trading

While a demo account’s primary function is to introduce traders to the platform’s mechanics and allow them to test different strategies, it lacks the psychological pressures that come with live trading. Real money, real emotions, and real consequences elevate the stakes. A Forex trading plan for beginners emphasizes understanding this difference and preparing mentally for the change.

Revisiting Your Forex Trading Plan for Beginners

Before you go live, it’s crucial to revisit your Forex trading plan for beginners. Ensure that the strategies you intend to use have been adequately tested in the demo environment. Furthermore, understand that not every strategy that worked in the demo might work in the live setting. Be prepared to adapt.

Starting Small and Scaling Up

One of the common recommendations in many Forex trading plans for beginners is to start with a small amount when transitioning to a live account. This approach minimizes the risk and gives new traders the opportunity to acclimatize to the new environment without exposing a significant portion of their capital.

Implementing Robust Risk Management Protocols

Risk management becomes even more crucial in a live trading scenario. The Forex trading plan for beginners should have a solid risk management strategy in place, including setting stop losses, determining the risk-to-reward ratio, and deciding the percentage of capital to risk per trade.

Embracing Emotional Resilience

A live account will bring with it a roller-coaster of emotions, from the highs of profitable trades to the lows of losses. Part of a comprehensive Forex trading plan for beginners involves cultivating emotional resilience, ensuring you don’t make impulsive decisions based on emotions.

Seeking Feedback and Continual Learning

Transitioning to live trading is a learning experience. It’s essential to continuously seek feedback, be it from your trading journal, mentors, or peers. A Forex trading plan for beginners should incorporate mechanisms for continuous learning and feedback loops.

Importance of Maintaining Balance

Mental and Emotional Well-being

Trading, by its very nature, is fraught with highs and lows. The roller coaster of emotions—from the thrill of a winning trade to the disappointment of a losing one—can be mentally draining. A Forex trading plan for beginners should prioritize mental well-being. This means setting boundaries on trading hours, taking regular breaks, and understanding that there will always be another trading opportunity around the corner.

Diversification as a Balancing Tool

Another key aspect of maintaining balance in a Forex trading plan for beginners is diversification. By spreading investments across various currency pairs or even other asset classes, beginners can reduce the risk of significant losses. This diversified approach provides a safety net and ensures that traders don’t put all their eggs in one basket.

Risk Management

Any well-thought-out Forex trading plan for beginners will heavily emphasize risk management. Knowing how much of your portfolio you’re willing to risk in a single trade, setting stop losses, and having clear exit strategies are all crucial. This is not just about preserving capital but also about maintaining emotional balance. A massive loss can deter a beginner from returning to the market.

Continuous Learning and Adaptability

The Forex market is dynamic, with trends and patterns shifting continually. Thus, an integral part of a balanced Forex trading plan for beginners is ongoing education. Continuous learning helps in adapting to market changes, ensuring that traders don’t become overly reliant on one strategy or approach.

Life Beyond Trading

It’s essential to remember that there’s life beyond the trading desk. A comprehensive Forex trading plan for beginners should encompass activities outside of trading. Engaging in hobbies, spending time with loved ones, and ensuring physical activity are all integral to maintaining balance. These activities provide an essential break, refresh the mind, and help in returning to the trading desk with a clearer perspective.

The Role of Reflection

A crucial yet often neglected component of a balanced Forex trading plan for beginners is self-reflection. Regularly assessing past trades, understanding what went right and what could’ve been done differently, is essential. This reflection not only aids in improving trading strategies but also helps in understanding one’s emotional responses to wins and losses.

Conclusion

As you embark on your Forex trading journey, always remember that a well-structured trading plan is your most reliable ally. Your ”Forex trading plan for beginners” serves as the foundation upon which you’ll build your trading empire, ensuring you’re equipped to tackle the market’s challenges head-on.

Forex Strategies for Beginners: Your Comprehensive Guide to Starting in Forex Trading

Forex Strategies for Beginners

Introduction

Forex trading is a vast and intricate world, and the absence of a well-defined strategy can be the difference between success and loss for beginners. Therefore, adopting sound forex strategies for beginners is not just advisable, but essential for anyone venturing into the world of currency trading.

Understanding Forex Trading

If you’re a novice, the initial step in creating an effective trading strategy involves understanding the rudiments of Forex trading. Let’s briefly discuss some basic terminologies:

  • Pip: The smallest price movement in forex, which influences your gains and losses.
  • Lot: Defines the size of the trade you’re making, and can be micro, mini, or standard.
  • Leverage: A double-edged sword, it allows you to control a large position with a small amount of money.
  • Margin: The amount needed in your account to maintain a leveraged position.

Additionally, you should familiarize yourself with the major currency pairs as they’re often the most traded and have high liquidity.

Building a Foundation: Education and Research

You’ve probably heard it said countless times – knowledge is power. In Forex, this adage couldn’t be truer. Prioritizing education is pivotal when developing ”forex strategies for beginners”. Here’s why:

  • Importance of Education: It equips you with the fundamentals, enabling you to make informed decisions. Ignorance is the fastest route to losses in trading.
  • Online Resources & Communities: Websites, webinars, and forums provide a plethora of information tailored for beginners. Harnessing them aids in your journey.
  • Set Realistic Expectations: No one becomes a Forex guru overnight. Be prepared for losses and learn from them. Celebrate small wins and remain steadfast during downturns.

Analysis Techniques

Both technical and fundamental analyses serve as the cornerstone of forex trading. Grasping these concepts is vital when learning forex strategies for beginners.

  1. Technical Analysis
    • Defining Technical Analysis: At its core, technical analysis involves examining past market data, mainly price and volume, to forecast future price movements. This analysis can be performed on any security with historical trading data. Here lies the birthplace of many forex strategies for beginners.
    • Chart Patterns: One of the first things beginners learn is to recognize patterns. Patterns like the head and shoulders, triangles, and flags indicate potential future price movements. Understanding these patterns early on will supercharge any beginner’s forex strategy.
    • Indicators and Oscillators: These are mathematical calculations based on the price, volume, or open interest of a security. Popular examples include the Moving Average (MA), Relative Strength Index (RSI), and Bollinger Bands. Incorporating these into forex strategies for beginners provides another tool in the arsenal to predict price movements.
    • Trend Lines: An essential aspect of technical analysis, trend lines help traders identify market direction. Recognizing an uptrend or a downtrend and knowing when a trend is about to reverse is a crucial skill for those crafting forex strategies for beginners.
  2. Fundamental Analysis
    • Understanding the Basics: Fundamental analysis, in contrast to technical analysis, involves evaluating a currency’s intrinsic value by analyzing related economic, financial, and other qualitative and quantitative factors.
    • Economic Indicators: Key to the toolbox of forex strategies for beginners are economic indicators. These data points, like inflation rates, employment numbers, and GDP growth, can significantly impact currency values.
    • Geopolitical Events: World events, political upheavals, and even natural disasters can cause substantial volatility in the forex markets. Keeping an eye on these events and understanding their potential impacts are crucial for those exploring forex strategies for beginners.
    • Interest Rates: They play a significant role in moving the prices of currencies in the forex market. A country with higher interest rates typically sees an appreciation in the value of its currency relative to the currencies of other nations.

Developing a Trading Plan

Embarking on your journey in the dynamic world of forex trading requires more than just theoretical knowledge. It calls for a well-thought-out trading plan that incorporates proven forex strategies for beginners. Here, we delve into the art of developing a robust trading plan, one that synergizes with beginner-level forex strategies to pave the path for a successful trading journey.

Step 1: Self-Assessment

Before you immerse yourself in trading, take time to assess your financial goals, risk tolerance, and trading style preference. Understanding your strengths and areas where you need improvement will help you select the most suitable forex strategies for beginners. This self-assessment stage forms the foundation of your trading plan, gearing you up for the decisions you’ll make down the line.

Step 2: Choosing the Right Forex Strategies for Beginners

When you’re new to the forex market, it’s essential to choose strategies that are not overly complex. Forex strategies for beginners are generally designed to be straightforward yet effective. They should encompass various aspects, including the time frames to trade, the currency pairs to focus on, and the technical indicators to use for signal generation. Research thoroughly and select strategies that align well with your risk tolerance and trading style.

Step 3: Setting Realistic Goals

A trading plan is incomplete without well-defined goals. It’s essential to set realistic expectations and clearly stated objectives, which will guide your trading journey. With the aid of forex strategies for beginners, these goals could range from achieving a certain percentage of monthly profits to maintaining a specific risk-reward ratio. Remember, the goal here is steady progress, not instant success.

Step 4: Risk Management

Risk management is the backbone of any successful trading plan. Even with the best forex strategies for beginners, you are bound to encounter losses. Hence, determining how much you are willing to risk per trade and adhering to it rigorously is vital. Implement tools like stop losses to safeguard your capital and ensure longevity in your trading career.

Step 5: Selecting the Right Trading Platform and Broker

Your trading plan should also incorporate the selection of a reliable trading platform and a trustworthy broker. When integrating forex strategies for beginners into your plan, ensure that your chosen platform supports these strategies seamlessly. Focus on factors like user-friendliness, customer support, and the range of available trading instruments.

Step 6: Continuous Learning and Adaptation

A good trading plan is not static. It allows room for continuous learning and adaptation. Forex strategies for beginners should serve as a starting point, but as you grow, so should your strategies and plan. Incorporate a learning schedule into your plan, dedicating time to study market trends, and adapting your strategies accordingly.

Step 7: Performance Evaluation

Regular evaluation of your trading performance is crucial. It helps in identifying the strengths and weaknesses of your current plan and the effectiveness of the forex strategies for beginners you are utilizing. Utilize the insights gained from these evaluations to fine-tune your trading plan and strategies continually.

Step 8: Emotional Discipline

Trading is not just about strategies and analysis; it’s significantly about managing your emotions well. Your trading plan should have guidelines in place to help you keep emotions at bay. Embracing emotional discipline will aid in implementing forex strategies for beginners more effectively, avoiding impulsive decisions, and maintaining a calm demeanor during trading sessions.

Risk Management

The Essence of Risk Management

At its core, risk management is about preserving your trading capital. It ensures that the inevitable losses one faces don’t wipe out significant portions of your investment. Every solid forex strategy for beginners prioritizes this aspect, given its crucial role in long-term trading success.

Why Risk Management Matters in Forex Trading

Forex trading can be highly volatile, and prices can move rapidly within short time frames. Without a robust risk management strategy, beginners can quickly find themselves in situations where losses are uncontrollable. Here’s why integrating risk management into forex strategies for beginners is non-negotiable:

  1. Preservation of Capital: The first goal isn’t to make money but to avoid losing it. A trader with capital is still in the game; one without is out of the action.
  2. Psychological Well-being: Watching a trade move against you can be stressful. Proper risk management helps in mitigating extreme stress, ensuring that you remain psychologically balanced for future trades.
  3. Allows for Mistakes: Every trader makes mistakes, especially when starting. Proper risk management ensures that these mistakes don’t become catastrophes.

Tools and Techniques

There are several tools and techniques beginners can use to manage risk:

  1. Stop-loss Orders: By setting a stop-loss order, you specify the maximum amount you’re willing to lose on a trade. This tool automatically closes your position once the market hits that predetermined level, guarding against further losses.
  2. Position Sizing: By only risking a small percentage of your trading account on a single trade, you ensure that even if things go south, your account remains relatively unscathed. Most experienced traders advise risking no more than 1-2% of your account on a single trade. For forex strategies for beginners, this is a golden rule.
  3. Diversification: While Forex primarily deals with currency pairs, there are many pairs to trade. Diversifying across various pairs can spread and thereby reduce risk.
  4. Limit Orders: This tool lets you exit a trade at a pre-defined level of profit. Like the stop-loss, it works automatically, ensuring you secure profits before market reversals can erode them.

Continuous Learning and Adaptation

The Forex market, by nature, is dynamic. Economic, political, and a host of other factors play into market movements. As such, what worked yesterday might not necessarily work today. Forex strategies for beginners should, therefore, be seen as continuously evolving blueprints. The importance of regularly reviewing, learning, and adapting one’s risk management strategies cannot be overemphasized.

Choosing the Right Trading Platform

The world of forex trading offers vast opportunities for potential gains. However, even with the best forex strategies for beginners, the right tools are necessary to execute these strategies effectively. One of these essential tools is your trading platform. It serves as the gateway to the market, offering tools and features that can significantly influence a trader’s efficiency and effectiveness.

Why is the Trading Platform So Important?

For beginners diving into the forex market, understanding the nuances can be a daunting task. Forex strategies for beginners often emphasize learning about currency pairs, understanding market dynamics, and setting clear goals. Yet, the choice of a trading platform is equally, if not more, crucial. Here’s why:

  • User Experience: A well-organized, user-friendly interface can significantly reduce the learning curve for beginners. The ease of navigating the platform, understanding charts, and executing trades can make the difference between a successful trade and a missed opportunity.
  • Accuracy of Information: Reliable and real-time data is the backbone of every forex strategy. For beginners, in particular, the accuracy of the market data presented on the platform can influence the effectiveness of their strategies.
  • Speed of Execution: Forex trading is all about timing. A slight delay in executing a trade can lead to missed profits. Hence, a platform’s efficiency in executing trades quickly is paramount.

Key Features to Look for in a Trading Platform

Forex strategies for beginners often involve a combination of technical and fundamental analysis. Therefore, the trading platform should offer features that support both approaches. Here are the essential features beginners should consider:

  • Advanced Charting Tools: For those employing technical analysis in their forex strategies for beginners, advanced charting tools are crucial. These tools allow traders to visualize price movements, identify trends, and spot potential trading opportunities.
  • Economic Calendar: Beginners focusing on fundamental analysis need a reliable economic calendar. It provides insights into upcoming economic events, announcements, and data releases that can influence currency price movements.
  • Customizability: No two traders are the same. Beginners should look for platforms that allow them to customize their interface, charts, and even set personal alerts. As they evolve their forex strategies for beginners, having a platform that adapts to their changing needs is invaluable.
  • Security Features: Forex trading involves significant capital. The platform should offer robust security features, including end-to-end encryption, two-factor authentication, and protection against potential cyber threats.

Demo Accounts and Practice Platforms

One of the most overlooked aspects when choosing a trading platform, especially when developing forex strategies for beginners, is the availability of demo accounts. These accounts allow beginners to practice their strategies with virtual money, helping them understand the platform’s functionalities and refine their trading techniques without any financial risk.

Broker Reputation and Support

The trading platform is often provided by forex brokers. It’s essential to choose a platform from a reputable broker with positive reviews and feedback. Beginners should also ensure that the broker offers excellent customer support, which can be crucial when faced with technical glitches or uncertainties about the platform’s features.

Building and Testing Forex Strategies

Entering the world of forex trading without a strategy is akin to embarking on a journey without a map. For novices, the road can be especially perilous without a well-thought-out plan. It’s no surprise, then, that building and testing forex strategies is a critical step to success in the forex market. Specifically for those just starting, the process of creating forex strategies for beginners can seem overwhelming, but with structured steps and careful planning, it can be made less daunting.

1. Identifying Your Trading Goals

Before you even think about a strategy, you need to understand what you want to achieve. This could range from achieving a steady income, safeguarding your investments against market volatility, or merely understanding the market dynamics. When you know your endgame, it becomes easier to tailor forex strategies for beginners that suit your objectives.

2. Selecting a Time Frame

Forex trading operates around the clock. So, are you looking to make quick trades within a day (day trading) or are you eyeing longer-term movements spanning weeks or even months (swing or position trading)? The time frame you choose can significantly influence the forex strategies for beginners you adopt.

3. Research and Education

To build effective forex strategies for beginners, one must be armed with knowledge. Understand key terms, how the market operates, and what influences currency movements. Resources abound online, from articles to webinars, that can help beginners grasp the basics.

4. Choose the Right Tools

Various tools, like technical indicators and chart patterns, can assist in predicting future price movements. For forex strategies for beginners, it’s advisable to start with a few essential tools rather than overwhelming oneself with too many.

5. Develop a Strategy

Now, with tools in hand and knowledge at your disposal, start crafting a strategy. This could be as simple as buying a currency pair when a particular technical indicator signals an upward trend. Remember, forex strategies for beginners don’t need to be overly complicated.

6. Backtest Your Strategy

Backtesting is the process of testing a strategy using historical data. By doing so, you can gauge how effective your forex strategies for beginners would have been in past market conditions. It provides an idea of potential profitability and areas of improvement.

7. Demo Trading

Before jumping into the live market, use a demo account. Almost every trading platform offers these practice accounts, allowing beginners to test their forex strategies in real-time without risking real capital. It’s an invaluable step in refining and gaining confidence in your strategy.

8. Continual Review and Iteration

No strategy, including forex strategies for beginners, is perfect from the outset. As you gain experience, continually review and adjust your strategy based on its performance and changing market conditions. Learning and adapting are integral parts of the forex trading journey.

9. Maintain Discipline

Building and testing forex strategies for beginners isn’t just about the technical aspects. A significant component is psychological. Even with a well-tested strategy, beginners must have the discipline to stick to it, avoid emotional trading decisions, and recognize when it’s time to exit a trade.

Implementing the Strategy

Once you have a strategy, it’s time to implement:

  • Start Small: Especially for beginners, it’s prudent to begin with small trades until you’re more confident.
  • Adapt and Learn: The Forex market is dynamic. Adapt your strategy when necessary and always be ready to learn.
  • Stay Emotionally Balanced: Losses will occur. Avoid the temptation to “chase” them. Stay calm, stick to your strategy, and avoid impulsive decisions.

Conclusion

The realm of Forex trading is vast and ever-evolving. But with the right ”forex strategies for beginners”, a solid foundation, and continuous learning, beginners can navigate the market more confidently. Remember, every expert was once a beginner.

Forex Signals Live: Unveiling the Future of Real-time Trading Insights

Forex Signals Live
Forex Signals Live

Introduction

In the dynamic world of Forex trading, staying ahead of trends and market movements is of paramount importance. One tool that has revolutionized trading strategies is the advent of Forex signals Live, allowing traders to make informed decisions in real-time. As the popularity of live forex signals platforms continues to surge, it’s critical to delve into their intricacies and understand how to leverage them to enhance trading strategies effectively.

What are Forex Signals Live?

Forex signals Live epitomizes the epitome of real-time market analysis and insights. Before venturing further, it’s vital to comprehend the core concept of live forex signals and distinguish them from delayed signals, which might offer historical data but lack the urgency that live signals provide.

Live forex signals are timely trade suggestions provided by analysts or automated systems, providing a treasure trove of information such as potential entry and exit points and risk management parameters, often crucial in the volatile forex markets. Understanding the difference between live and delayed signals helps in crafting strategies that are more in tune with the rapid fluctuations witnessed in the forex market.

The Anatomy of a Live Forex Signal

As we unravel the anatomy of a Forex signals Live suggestion, we see a concoction of carefully analyzed elements crafted to aid in precise decision-making. Originating from experienced analysts or sophisticated algorithms, live signals provide a glimpse into the potential market movements based on various factors, including technical analysis and current market trends.

An essential feature of Forex signals Live is the detailed information they contain. Not confined to mere suggestions, these signals provide a comprehensive view including entry points, stop-loss levels, and take-profit targets, facilitating traders to make decisions swiftly and efficiently. Moreover, the time-sensitive nature of these signals means traders need to act promptly to capitalize on potential opportunities, emphasizing the importance of real-time data and insights.

Benefits of Using Forex Signals Live

Real-time Decision Making

Forex signals Live offers traders the unique advantage of making decisions in real-time. The forex market is notoriously volatile, with currency pair values fluctuating minute-by-minute. Having access to live signals ensures that traders can react promptly to any sudden changes in the market, capitalizing on potential opportunities or avoiding potential losses.

Enhanced Confidence for Novices

For newcomers stepping into the vast world of forex trading, the initial phase can be overwhelming. Forex signals Live serves as a guiding light, providing them with expert insights that can boost their confidence. These signals offer beginners a clearer understanding of market movements and potential trading opportunities, thus reducing the steep learning curve often associated with forex trading.

Adaptability to Various Trading Styles

Every trader has their unique style, ranging from scalping, where trades might last minutes, to swing trading, where positions could be held for days or even weeks. Forex signals Live seamlessly adapts to these diverse trading styles. The real-time insights they provide can be crucial, whether you’re looking for quick gains or long-term positions.

Reduced Need for Extensive Analysis

While it’s always recommended for traders to do their homework, Forex signals Live can lessen the burden of extensive market analysis. These live signals come from seasoned experts or sophisticated algorithms that have already done the grunt work. By using Forex signals Live, traders can leverage this expertise and save considerable time, focusing more on execution than analysis.

Access to a Broader Perspective

One of the key strengths of Forex signals Live is that they provide traders with a holistic view of the market. These signals are typically based on a blend of technical and fundamental analysis, ensuring that traders receive a well-rounded perspective. This can be especially beneficial in understanding the broader market trends and making more informed trading decisions.

Risk Management

Forex signals Live often come with additional details such as suggested stop-loss and take-profit levels. For traders, especially those new to the game, this can be a game-changer. By adhering to these suggested levels, traders can ensure that they manage their risks effectively, safeguarding their investments from unexpected market downturns.

Continuous Learning

For those keen on mastering the art of forex trading, Forex signals Live provides an unparalleled learning opportunity. By analyzing the signals and understanding the rationale behind them, traders can continuously refine their strategies and expand their knowledge base. Over time, this can lead to better trading decisions and enhanced profitability.

Platforms and Technologies Supporting Live Forex Signals

Evolution of Forex signals Live Platforms

The journey of Forex signals Live started from basic SMS notifications, where traders would get a text regarding potential market movements. These have now evolved into sophisticated platforms that not only notify but also allow for seamless trading. The push from rudimentary to advanced was fueled by the need for real-time data, instant analytics, and more in-depth insights.

Web-based Platforms

Web platforms were among the first to embrace Forex signals Live. Websites dedicated to forex analysis began to offer live signal services, where traders could log in and get real-time signals. Today, these platforms have integrated various tools such as charts, market news, and even automated trading capabilities. Websites like Myfxbook and MQL5 have grown in popularity, thanks in part to their Forex signals Live functionalities.

Mobile Applications

The rise of smartphones changed the game for Forex signals Live. Mobile apps enabled traders to carry the power of live signals in their pockets. Apps like MetaTrader, eToro, and many others introduced push notifications for live forex signals. Traders can now receive signals, analyze them, and make trade decisions on the go. The convenience offered by mobile apps has undeniably made them a preferred choice for many.

AI and Machine Learning

The real transformative shift for Forex signals Live came with the integration of artificial intelligence (AI) and machine learning. AI-driven platforms analyze vast data sets at incredible speeds to predict market movements. Machine learning, on the other hand, allows these platforms to learn from past data and refine their predictions over time. As a result, Forex signals Live generated from AI and machine learning platforms tend to be more accurate and timely.

Integration with Trading Platforms

Modern trading platforms like MetaTrader 4 and 5, NinjaTrader, and cTrader have begun to integrate Forex signals Live directly into their systems. This integration allows traders to receive signals and execute trades from the same platform, eliminating the need to juggle between multiple tools. This synergy has led to smoother and more efficient trading workflows.

Social Trading and Copy Trading Platforms

One of the fascinating developments in the world of Forex signals Live is the concept of social trading. Platforms like ZuluTrade and eToro’s CopyTrader allow traders to follow and copy the trades of professional traders in real-time. These platforms essentially turn the trading strategies of professionals into live signals for other traders to replicate, democratizing access to expert insights.

Chatbots and Messaging Platforms

In an age where instant messaging platforms are ubiquitous, Forex signals Live has found a new home. Chatbots on platforms like Telegram and Slack can now deliver live forex signals. These bots use AI and algorithms to generate signals and send them directly to users in the form of messages.

Evaluating the Authenticity and Reliability of Live Forex Signals

1. Understanding the Source

The first step in evaluating the authenticity of Forex signals Live is understanding where they originate from. Signals can come from either human analysts or automated algorithms.

Human analysts often have years of experience and a nuanced understanding of market dynamics. They can factor in external elements such as geopolitical events or economic announcements that might affect market behavior. On the other hand, automated algorithms work by analyzing vast amounts of data at high speeds. They’re often more suited to high-frequency trading and can identify patterns and trends that might be less apparent to human analysts.

2. Track Record and Historical Performance

One of the most robust ways to judge the reliability of Forex signals Live is by looking at their past performance. While past performance isn’t always an accurate indicator of future results, a consistent track record over a more extended period can be a good sign. Platforms or providers that offer access to their historical data are typically more transparent and reliable.

3. Transparency in Signal Generation

The more transparent a Forex signals Live provider is about its signal generation process, the more trustworthy it usually is. Reliable providers explain the strategies, indicators, and analytical tools they use to derive their signals. This transparency allows traders to understand the rationale behind each signal, enabling them to make more informed decisions.

4. Signal Consistency and Frequency

Forex markets are open 24/7, and market conditions can change rapidly. Therefore, a reliable Forex signals Live provider should be consistent in delivering signals, irrespective of the market’s volatility. If signals are sporadic or too infrequent, traders might miss out on crucial trading opportunities or might get signals when it’s too late to act.

5. Feedback and Reviews

Another vital method to evaluate the reliability of Forex signals Live is by checking feedback and reviews from other users. If many traders vouch for the accuracy and timeliness of the signals, it can be a good indication of the provider’s reliability. However, traders should be cautious and discerning, as some reviews can be biased or paid for.

6. Free Trials and Demo Accounts

Many reputable Forex signals Live providers offer free trials or demo accounts for traders. This allows traders to test the quality and reliability of the signals without any financial commitment. It’s a great way to gauge the signal’s timeliness, accuracy, and relevance to a trader’s specific strategy.

7. Beware of Overpromising

In the competitive world of forex trading, some Forex signals Live providers might resort to making grand promises of guaranteed profits or incredibly high success rates. It’s essential to approach such claims with skepticism. Trading is inherently risky, and no signal, no matter how accurate, can guarantee profits.

8. Cost Considerations

While it’s true that quality often comes at a price, the most expensive Forex signals Live provider isn’t necessarily the best. Traders should weigh the cost of the service against the value it offers, considering factors like signal accuracy, frequency, customer support, and additional resources like educational content.

Integrating Live Forex Signals into a Broader Trading Strategy

Understanding the Power of Forex signals Live

Before integrating anything into a strategy, it’s imperative to understand its value. Forex signals Live are real-time alerts about potential trading opportunities based on technical analysis, market trends, and sometimes, fundamental events. They offer traders a chance to catch a trend in its nascent stages, potentially leading to profitable outcomes.

Leveraging Forex signals Live with Other Technical Analysis Tools

While Forex signals Live can provide traders with real-time insights, combining these with other technical analysis tools can enhance decision-making. For instance, if a live signal suggests buying a particular currency pair, and this is backed up by strong bullish patterns on candlestick charts or positive readings from oscillators like the RSI, it provides an added layer of confidence to the trade decision.

Factoring in Fundamental Analysis

The forex market, being deeply influenced by global events, economic data, and geopolitical situations, requires traders to factor in fundamental analysis. When you receive a trade signal from your Forex signals Live service, it’s wise to cross-reference it with the current global events. If both fundamental and live signal pointers align, it can be a strong indication to proceed with the trade.

Setting Up Proper Risk Management Protocols

One of the critical aspects of any trading strategy is risk management. Even when using Forex signals Live, traders shouldn’t forget the golden rule of only risking a fraction of their trading capital on a single trade. Live signals, despite their real-time nature, aren’t foolproof. Incorporating stop-loss orders and take-profit points, which often come with these signals, into a broader risk management strategy is essential.

Back-testing and Forex signals Live

Every seasoned trader knows the importance of back-testing a strategy. While real-time forex signals provide current market insights, examining how similar signals would have performed in the past can be enlightening. It helps traders refine their approach, making their integration of Forex signals Live even more effective in the broader strategy.

Maintaining Flexibility in Strategy

Markets are dynamic, and what works today might not be as effective tomorrow. As such, traders should ensure that their strategy, even when primarily relying on Forex signals Live, remains flexible. It means being open to tweaking the strategy based on market conditions, feedback from live signals, and personal trading experiences.

Education and Continuous Learning

Lastly, and most importantly, traders should never stop learning. Forex signals Live are tools that can guide a trader, but understanding the mechanics behind these signals is crucial. Continuous education about how these signals are derived, the technology behind them, and the market factors they consider will allow traders to use them more judiciously within a broader trading strategy.

Ethical Considerations in Using Live Forex Signals

Dependence vs. Independent Analysis

One of the primary concerns surrounding Forex signals Live is the potential over-reliance on them. While these signals can provide valuable real-time insights, solely depending on them might deter traders from conducting their own research and analysis. Ethically, it’s crucial for traders to ensure that they’re not just following signals blindly but are complementing them with their analysis, ensuring a well-rounded and informed decision-making process.

Source of the Signals

The origin of Forex signals Live is another significant ethical concern. Not all signal providers are created equal, and while some genuinely offer insights based on thorough market analysis, others might be less scrupulous. There’s a responsibility on traders to ensure that the signals they’re acting upon come from reputable sources. Acting on misleading or manipulated signals not only jeopardizes one’s investments but also compromises the integrity of the trading process.

Privacy Concerns

With the proliferation of Forex signals Live platforms, traders often provide personal and trading information. Ethical providers should be transparent about how they handle, store, and potentially share this data. Traders, in turn, must be diligent in understanding these data practices to ensure their privacy and security are not compromised.

Financial Responsibility

While Forex signals Live can hint at potential profitable trades, they can also go the other way. It is ethically essential for traders not to overextend themselves based on a signal. This means not investing more than they can afford to lose and understanding the inherent risks of each trade, even if a live signal suggests otherwise.

Push for Authenticity

The allure of Forex trading, combined with the immediacy of Forex signals Live, can sometimes push traders towards inauthentic trading behaviors. This might include chasing losses based on a string of positive signals or, conversely, abandoning solid trading strategies after a few negative signals. Maintaining authenticity in trading actions, staying true to one’s strategies, and not being overly swayed by live signals is an ethical imperative.

Education and Awareness

As the saying goes, “knowledge is power.” Ethically, it’s pivotal for traders to continually educate themselves, not just about the market conditions but also about the tools they use, including Forex signals Live. An informed trader can make ethical decisions, discern the quality of live signals, and navigate the complexities of the forex market with integrity.

Precautions and Best Practices When Using Forex Signals Live

1. Understanding the Source

Before acting on any Forex signals Live, it’s crucial to understand where these signals are coming from. Are they generated by a reputable analyst or through a recognized automated system? The credibility of the source can significantly impact the reliability of the signal.

2. Avoiding Over-reliance

Forex signals Live are undoubtedly valuable, but they shouldn’t be the only tool in a trader’s toolkit. It’s crucial to use these signals as part of a broader strategy, incorporating other analysis methods and tools to ensure a balanced approach to trading.

3. Setting Personal Limits

Forex signals Live can sometimes suggest trades that might be outside a trader’s comfort zone or risk tolerance. It’s vital for traders to set personal boundaries and ensure they’re comfortable with the trades they’re making, regardless of what the live signals suggest.

4. Immediate Action but with Caution

The nature of Forex signals Live is that they are time-sensitive. While it’s often necessary to act quickly to take advantage of the signal, it’s equally essential to exercise caution. Rapid decisions can lead to mistakes, so always ensure you understand the signal before acting on it.

5. Continuous Learning and Adaptation

The world of forex is always evolving, and so are the strategies and tools associated with it. Traders must continue to educate themselves about the latest trends, tools, and strategies. Using Forex signals Live effectively requires understanding their nuances and adapting to their intricacies.

6. Risk Management is Paramount

Even when using Forex signals Live, there’s always an element of risk involved in trading. Effective risk management strategies, such as setting stop-loss orders and only risking a small percentage of one’s trading capital, remain essential.

7. Regularly Reviewing Signal Performance

It’s a good practice to regularly review the performance of the Forex signals Live you’re receiving. Are they consistently accurate? Are they leading to profitable trades? Regular reviews can help traders determine the effectiveness of their live signal provider and make informed decisions about continuing their services.

8. Stay Informed

Forex signals Live provide real-time trading suggestions, but it’s also crucial for traders to stay informed about global news and events that might impact the forex market. Economic announcements, political events, and other significant happenings can influence currency pairs, and it’s essential to be aware of these when considering live signals.

9. Beware of Signal Scams

With the rising popularity of Forex signals Live, there’s an unfortunate emergence of scams and misleading providers. Always ensure the legitimacy of a signal provider through reviews, recommendations, and their track record.

10. Ethical Trading is Important

Remember that behind every trade, there’s a human element involved. It’s essential to approach Forex signals Live with an ethical mindset, ensuring fairness, honesty, and integrity in all trading actions and decisions.

Conclusion

The landscape of forex trading has witnessed a significant transformation with the advent of ”Forex signals Live”. As traders continue to harness the power of these real-time insights, the future of forex trading looks more informed, dynamic, and promising. Embracing the tools and technologies available while ensuring informed and responsible trading will undoubtedly pave the way for more successful trading ventures in the future.