Introduction
TradingView is a popular and powerful web-based charting and trading platform that offers traders access to a wide range of technical analysis tools. One such tool is the Williams %R indicator, a momentum oscillator that helps traders identify overbought and oversold conditions. In this article, we’ll explore how to use the Williams %R indicator TradingView integration effectively to enhance your trading analysis and decision-making.
Getting Started with TradingView
Before diving into the Williams %R indicator, it’s essential to understand how to navigate the TradingView platform.
Creating an Account
To get started with TradingView, visit their website and sign up for a free account. You can also choose a paid subscription plan for additional features and benefits, such as more indicators, real-time data, and enhanced customer support.
Exploring the TradingView Interface
Once you’ve created your account, familiarize yourself with the TradingView interface. Key components include the chart area, drawing tools, time frame selection, and watchlist panel.
Selecting a Chart Type and Time Frame
TradingView offers various chart types, including candlestick, bar, and line charts. Choose the chart type that you prefer and select the appropriate time frame for your trading strategy, ranging from minutes to months.
Adding the Williams %R Indicator to Your Chart on TradingView
To implement the Williams %R indicator TradingView integration, follow these simple steps:
Accessing the Indicators Menu
On the TradingView chart, click the ‘Indicators’ button at the top of the screen. This will open a menu containing a vast selection of technical indicators and tools.
Searching for Williams %R Indicator
In the search bar of the indicators menu, type “Williams %R” and select the indicator from the list of results. The indicator will be automatically added to your chart.
Customizing the Indicator Settings
After adding the Williams %R indicator to your chart, you can customize its settings to suit your preferences.
- Lookback Period: By default, the Williams %R indicator uses a 14-period lookback. To modify this value, click on the indicator’s settings icon and adjust the ‘Length’ parameter.
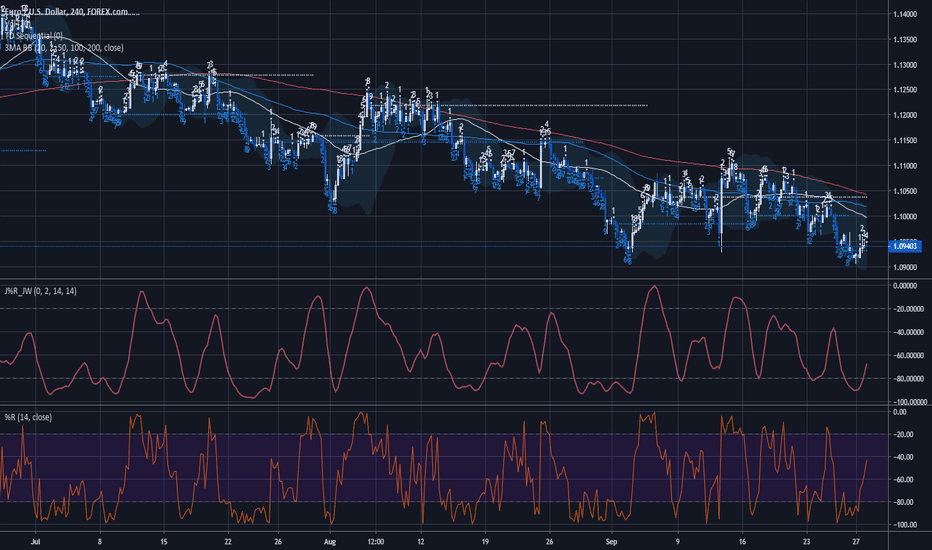
- Overbought and Oversold Levels: The standard overbought and oversold levels for the Williams %R indicator are -20 and -80, respectively. You can customize these levels in the settings menu under ‘Upper Line’ and ‘Lower Line’.
- Line Color and Style: Change the appearance of the indicator line by adjusting its color, thickness, and style in the settings menu under ‘Line’.
Implementing the Williams %R Indicator Strategy on TradingView
With the Williams %R indicator TradingView integration set up, it’s time to implement the strategy effectively.
Identifying Buy and Sell Signals
The basic Williams %R indicator strategy involves looking for buy and sell signals based on overbought and oversold conditions. A buy signal occurs when the indicator moves below the oversold level and then crosses back above it. Conversely, a sell signal occurs when the indicator moves above the overbought level and then crosses back below it.
Using Advanced Techniques
To improve the effectiveness of the Williams %R indicator TradingView strategy, consider incorporating advanced techniques:
- Divergence: Divergence occurs when the price and the Williams %R indicator move in opposite directions. Bullish divergence (price making lower lows and the indicator forming higher lows) suggests a potential trend reversal to the upside. Bearish divergence (price making higher highs and the indicator forming lower highs) indicates a potential trend reversal to the downside.
- Support and Resistance Levels: Combine the Williams %R indicator with support and resistance levels to confirm trend strength or identify potential reversal points. When the indicator bounces off an oversold level near significant support, it may signal a bullish trend. Similarly, when the indicator declines from an overbought level near critical resistance, it may suggest a bearish trend. 3. Trend-Following Methods: Enhance the Williams %R indicator TradingView strategy by incorporating trend-following techniques. For instance, use moving averages to identify the overall market direction and take trades in line with the prevailing trend.
Combining the Williams %R Indicator with Other TradingView Tools
To further improve the reliability of the Williams %R indicator TradingView strategy, consider combining it with other technical analysis tools available on the platform:
- Moving Averages: Use moving averages to filter out false signals and confirm the overall market direction.
- RSI and Stochastic Oscillator: Combine the Williams %R indicator with the RSI or Stochastic Oscillator for additional confirmation of overbought and oversold conditions.
- Bollinger Bands: Bollinger Bands can help identify potential reversal points when used in conjunction with the Williams %R indicator.
- Drawing Tools: Utilize TradingView’s drawing tools, such as trendlines and Fibonacci retracements, to complement the Williams %R indicator strategy.

Setting Alerts and Notifications for Williams %R Indicator on TradingView
Stay informed about potential trading opportunities by setting up alerts and notifications for the Williams %R indicator TradingView strategy.
Creating an Alert for Overbought and Oversold Conditions
To create an alert, click the ‘Alerts’ button at the top right corner of the TradingView interface. In the ‘Condition’ dropdown menu, select the Williams %R indicator and specify the overbought or oversold level. Then, choose the alert frequency and expiration date.
Customizing Alert Settings
You can customize your alerts by selecting the type of notification you’d like to receive (e.g., email, SMS, or pop-up) and adding a custom message to remind you of the specific trading conditions.
Managing Your Alerts
To view, edit, or delete your alerts, go to the ‘Alerts’ tab on the right side of the TradingView interface.
Analyzing Trade Performance with the Williams %R Indicator on TradingView
Track your trading performance using the Williams %R indicator with TradingView’s trade performance tools.
Using the TradingView Trade Performance Tool
TradingView’s trade performance tool allows you to analyze your trades based on various metrics, such as win rate, average profit, and risk-reward ratio. Access this tool by clicking on the ‘Trading Panel’ at the bottom of the chart and selecting ‘Performance Summary.’
Reviewing Trades Based on Williams %R Indicator Signals
Analyze your trades specifically based on the Williams %R indicator TradingView signals to identify areas for improvement and refine your trading strategy.
Identifying Areas for Improvement
Use the insights gained from the trade performance analysis to adjust your trading approach, risk management, and position sizing.
Tips for Using the Williams %R Indicator on TradingView
Maximize the effectiveness of the Williams %R indicator TradingView strategy with these tips:
- Leveraging TradingView’s Social Features: Take advantage of TradingView’s social features, such as idea sharing, chat rooms, and following other traders, to learn and gain insights from the community.
- Saving Chart Layouts for Future Use: Save your customized chart layouts, including the Williams %R indicator settings, for quick access in future trading sessions.
- Continuously Updating and Refining Your Trading Strategy: Stay informed about market news and developments and continuously update and refine your Williams %R indicator TradingView strategy to stay ahead of the curve and improve your trading performance.
Williams %R indicator TradingView Conclusion
The Williams %R indicator is a powerful tool for identifying overbought and oversold conditions in the market. By integrating the indicator with the TradingView platform, you can access a wide range of additional tools and features to enhance your trading analysis and decision-making.
Remember, consistency and discipline are critical when using the Williams %R indicator TradingView strategy. By following your trading plan, continuously learning from your experiences, and staying up-to-date with market developments, you can maximize your potential for success in the financial markets.

