A Comprehensive Guide to Forex News: Sources, Impact on Market, and Trading Strategies in 2023

Introduction

Forex news
Forex news

The foreign exchange market, or forex, is a constantly evolving and dynamic marketplace where currency values are constantly in flux. As a trader, it is important to stay up-to-date with the latest forex news in order to make informed trading decisions. Forex news refers to the economic and financial events, developments, and news that can impact the foreign exchange market and influence currency exchange rates. From interest rate decisions by central banks to political events and natural disasters, forex news can have a significant impact on the market. In this guide, we will dive into the world of forex news, exploring the websites that provide the latest updates, examining the events that have the greatest impact, and offering tips on how to trade the forex news like a pro.

Websites that provide Forex News

In order to stay up-to-date with the latest forex news, it is important to have access to reliable and accurate sources. There are several websites that offer comprehensive coverage of forex news and events, including:

  1. Reuters: Reuters is a global news agency that provides coverage of financial markets, including the foreign exchange market. The website offers real-time news and analysis, as well as economic calendars and market data.
  2. Bloomberg: Bloomberg is a financial news and data provider that offers comprehensive coverage of the forex market. The website features real-time news, analysis, and market data, as well as a calendar of upcoming economic events.
  3. CNN Money: CNN Money is a financial news website that offers coverage of the latest developments in the foreign exchange market. The website features real-time news, analysis, and market data, as well as a calendar of upcoming economic events.
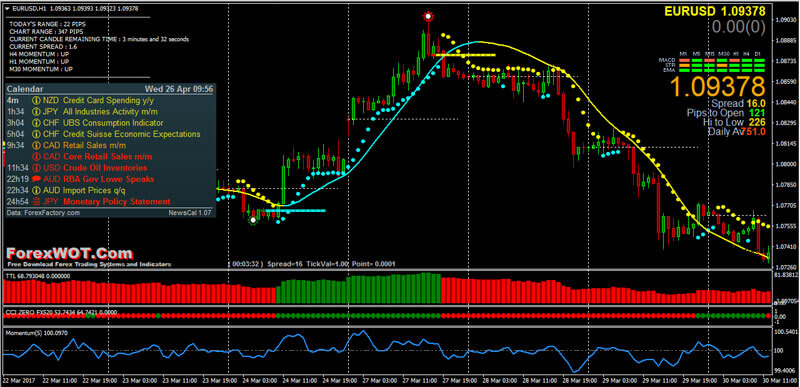
  4. Forex Factory: Forex Factory is a dedicated forex news website that provides traders with a wealth of information and resources. The website features real-time news and analysis, as well as an economic calendar, market data, and forums for traders to discuss the latest developments in the market.
  5. Daily FX: Daily FX is a forex news and analysis website that offers real-time news, market data, and analysis, as well as a calendar of upcoming economic events. The website also features educational resources and tools for traders to improve their knowledge of the forex market.
  6. FXStreet: FXStreet is a forex news and analysis website that offers real-time news, market data, and analysis, as well as a calendar of upcoming economic events. The website also features a range of educational resources and tools for traders, including webinars and eBooks.
  7. Social media platforms like Twitter and LinkedIn can be valuable sources of real-time news and analysis, as many market commentators and analysts share their insights and opinions on these platforms.
  8. Forex forums and discussion boards can provide a wealth of information and perspective from other traders and market participants.
  9. Market research and analysis firms, such as Thomson Reuters and Moody’s, can offer in-depth market analysis and research reports that provide valuable insights into the latest developments in the forex market.
  10. Broker websites and trading platforms may also provide their own news and analysis services, as well as real-time market data and trading tools.

By using a combination of these resources, traders can stay well-informed about the latest forex news and events, and make informed trading decisions based on the most up-to-date information and analysis.

Examples of Forex News with High Impact on the Market

Forex news can have a significant impact on the foreign exchange market, influencing currency exchange rates and affecting the value of trades. Here are some of the key forex news events that can have a high impact on the market:

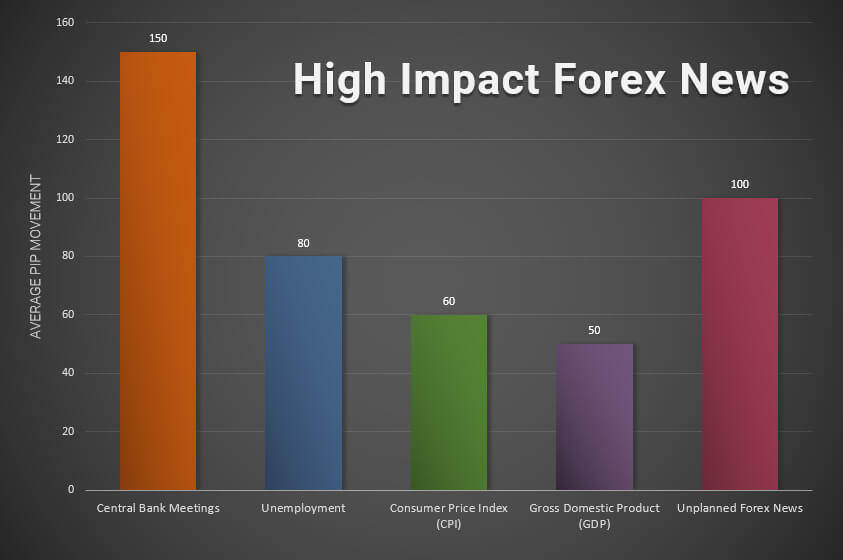
  1. Interest rate decisions by central banks: Central banks, such as the Federal Reserve (Fed) in the United States and the European Central Bank (ECB) in Europe, regularly announce decisions on interest rates. These decisions can have a major impact on currency exchange rates, as changes in interest rates can affect the relative value of different currencies and impact the cost of borrowing in a currency.
  2. Economic data releases: Economic data releases, such as Gross Domestic Product (GDP) reports and employment figures, can provide insight into the health of an economy and influence currency exchange rates. Strong economic data can signal a growing economy and increase demand for a currency, while weak data can signal economic weakness and decrease demand for a currency.
  3. Political events: Political events, such as elections and policy changes, can have a major impact on currency exchange rates. For example, political instability or uncertainty in a country can decrease demand for its currency, while political stability and stability can increase demand for a currency.
  4. Natural disasters: Natural disasters, such as hurricanes and earthquakes, can disrupt economic activity and impact currency exchange rates. For example, a natural disaster in a country can disrupt its economy, decrease demand for its currency, and impact the value of trades.

These are just a few examples of the types of forex news events that can have a high impact on the market. By staying up-to-date with the latest news and events, traders can be better prepared to navigate the dynamic world of foreign exchange.

Impact of Forex News on the Market

  1. Volatility and Liquidity – Forex news releases can cause significant volatility and liquidity in the market, as traders adjust their positions in response to new information.
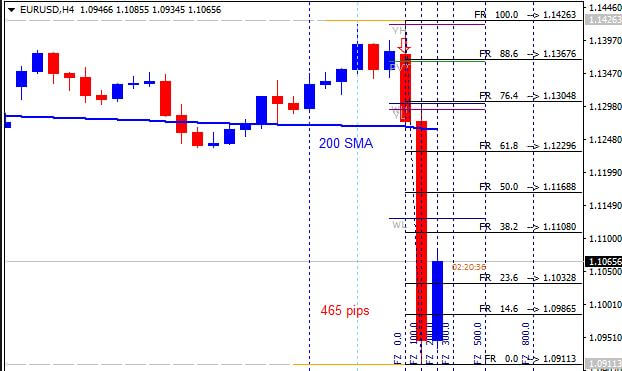
  2. Price Movements – Forex news can cause significant movements in currency pairs, as traders buy or sell based on the perceived impact of the news on the underlying economy or financial markets.
  3. Trading Volume – Forex news can lead to increased trading volume, as traders take advantage of new trading opportunities or adjust their positions in response to changing market conditions.
  4. Risk Management – Forex news can affect traders’ risk management strategies, as they adjust their stop-loss levels, position sizes, or overall risk exposure in response to new information.
  5. Sentiment – Forex news can impact market sentiment, which can affect traders’ perceptions of the market and their willingness to take positions in certain currency pairs.
  6. Interest Rates – Forex news can impact interest rates and central bank policy decisions, which can have a significant impact on currency values and trading strategies.
  7. Economic Indicators – Forex news can provide important economic indicators, such as GDP, inflation, and employment data, which can help traders assess the overall health of an economy and make trading decisions accordingly.
  8. Technical Analysis – Forex news can impact technical levels on price charts, which can affect the behavior of technical traders and the overall direction of the market.
  9. Global Events – Forex news can be influenced by global events, such as political elections, natural disasters, or geopolitical tensions, which can have far-reaching effects on the economy and the forex market.
  10. Market Participants – Forex news can affect the behavior of various market participants, such as retail traders, institutional investors, hedge funds, and central banks, all of which can have a significant impact on market dynamics.
Forex news
Forex news

How to Trade Forex News Like a Pro

Trading based on forex news can be a profitable strategy for experienced traders, but it can also be risky for inexperienced traders who are not familiar with the market and the potential impact of news events. Here are some tips for trading forex news like a pro:

  1. Stay informed and up-to-date – Keep track of upcoming economic events and data releases, and monitor financial news outlets and social media for important updates and analysis.
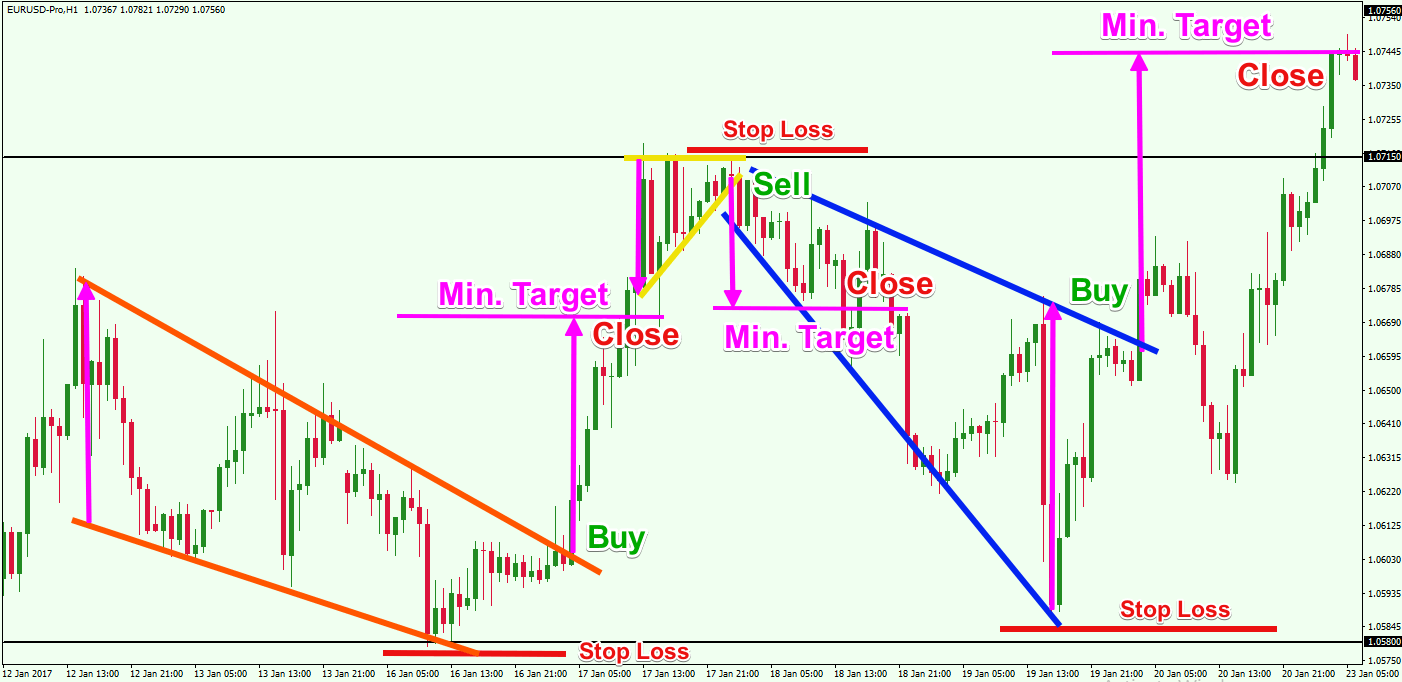
  2. Develop a trading plan – Before trading forex news, create a trading plan that outlines your objectives, risk tolerance, and entry and exit strategies.
  3. Use appropriate risk management strategies – Consider using tools like stop-loss orders, position sizing, and diversification to manage risk.
  4. Maintain a disciplined approach to trading – Stick to your trading plan and avoid impulsive decisions based on emotion or short-term price movements.
  5. Consider a range of analysis techniques – Use a combination of fundamental, technical, and sentiment analysis to make informed trading decisions.
  6. Be mindful of timing – Take note of the timing of news releases and events, as they can affect market liquidity and volatility.
  7. Keep an eye on market sentiment – Stay aware of market sentiment and try to avoid trading against the prevailing sentiment.
  8. Stay aware of potential biases – Be aware of your own biases and try to avoid them when making trading decisions.
  9. Practice risk management before news events – Reduce your position size or close out trades before significant news events to minimize potential losses.
  10. Learn from your experiences – After each news event, review your trades and analyze your performance to identify areas for improvement.

By following these tips, traders can trade forex news like a pro and increase their chances of success in the dynamic and rapidly-changing world of foreign exchange.

Trading Strategies for Forex News

  1. Fundamental Analysis – This approach involves analyzing economic data, central bank policy decisions, and other macroeconomic factors to determine the overall health of an economy and the likely direction of currency pairs.
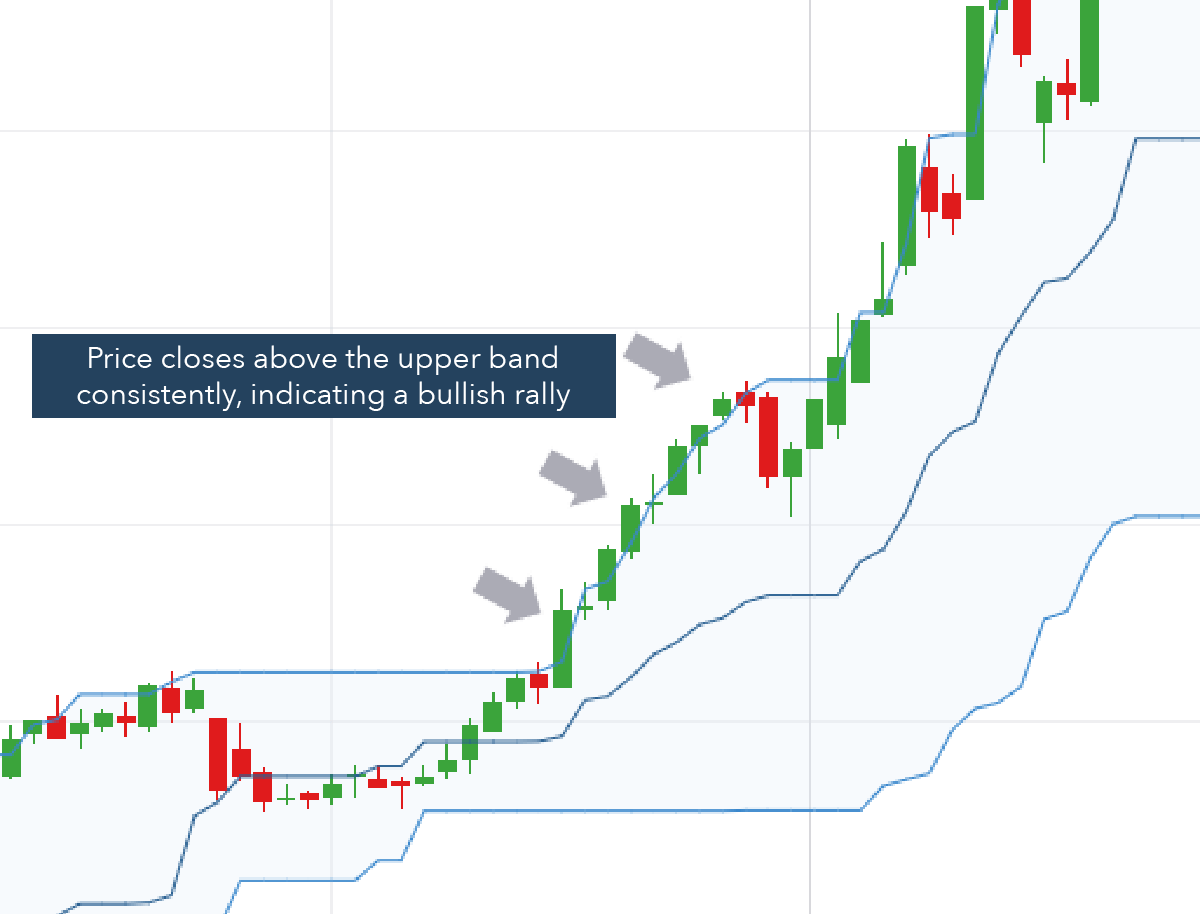
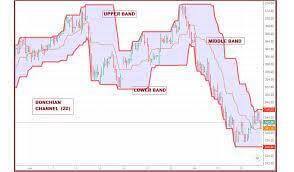
  2. Technical Analysis – This approach involves analyzing price charts and using technical indicators to identify trading opportunities and potential market trends.
  3. Sentiment Analysis – This approach involves analyzing market sentiment and assessing the market’s overall mood towards a currency or an economic event. This can be useful in predicting short-term price movements.
  4. Event-Driven Trading – This approach involves analyzing the potential impact of specific events or news releases on currency markets and taking positions based on that analysis.
  5. News Trading – This approach involves trading on the immediate reaction to an economic event or news release, often using automated trading algorithms to execute trades quickly.
  6. Volatility Trading – This approach involves trading based on the expected level of volatility associated with a particular economic event or news release.
  7. Carry Trading – This approach involves taking advantage of interest rate differentials between currency pairs to generate profit over the long term.
  8. Correlation Trading – This approach involves analyzing the relationship between currency pairs and taking positions based on that analysis.
  9. Breakout Trading – This approach involves trading based on significant price movements or breakouts of key technical levels.
  10. Position Trading – This approach involves taking longer-term positions based on fundamental or technical analysis and holding those positions for weeks or months.
Forex news
Forex news

When Forex News is Released

Forex news events can take place at any time, but there are certain times when they are most likely to be released. Here are some key times to be aware of when trading based on forex news:

  1. Interest rate decisions by central banks: Interest rate decisions are typically announced at regular intervals, such as monthly or quarterly. Traders should be aware of the schedule for these announcements and be prepared for potential market movements in response to these events.
  2. Economic data releases: Economic data releases, such as GDP reports and employment figures, are usually released at specific times, such as monthly or quarterly. Traders should be aware of the schedule for these releases and be prepared for potential market movements in response to these events.
  3. Political events: Political events, such as elections and policy changes, can take place at any time. Traders should be aware of the potential impact of these events on the market and be prepared for potential market movements in response to these events.
  4. Natural disasters: Natural disasters can occur at any time, but traders should be aware of the potential impact of these events on the market and be prepared for potential market movements in response to these events.

By understanding the timing of forex news events, traders can be better prepared to navigate the market and make informed trading decisions based on market conditions and events.

Benefits in Trading Forex News

  1. Provides Trading Opportunities – Forex news can create significant trading opportunities for those who are prepared and informed.
  2. Increases Market Volatility – Forex news releases can create significant volatility in the markets, which can lead to increased profit potential for traders.
  3. Helps Identify Market Trends – Forex news can provide important information about the overall health of an economy, which can help traders identify potential market trends.
  4. Enables Trading on Multiple Timeframes – Forex news can impact trading on multiple timeframes, from short-term intraday trading to long-term position trading.
  5. Offers Diversification – Trading forex news can provide diversification for traders who are looking to expand their trading activities beyond other markets, such as stocks or commodities.
  6. Improves Trading Knowledge – Forex news can provide valuable insights into global economics, politics, and financial markets, which can help traders improve their overall trading knowledge.
  7. Enhances Risk Management – Forex news can help traders better manage their risk by providing important information about potential market events and volatility.
  8. Increases Trading Volume – Forex news can lead to increased trading volume, which can provide greater liquidity and potentially better trading opportunities for traders.
  9. Facilitates Automation – Forex news trading can be automated using algorithmic trading strategies, which can help traders execute trades quickly and efficiently.
  10. Offers High Potential Rewards – Trading forex news can offer high potential rewards, particularly for those who are able to accurately predict market reactions to economic events and news releases. However, it’s important to remember that higher potential rewards come with higher potential risks.

Risks and Challenges in Trading Forex News

  1. False or Misleading Information – Forex news can be influenced by rumors, speculation, and even deliberate misinformation, which can cause traders to make decisions based on inaccurate or incomplete information.
  2. Market Reactions that Differ from Expectations – Even if a trader accurately predicts an upcoming economic event, the market’s reaction to that event may not align with their expectations. Unexpected outcomes can result in significant losses.
  3. Timing Issues – Forex news is often released outside of regular trading hours, which can lead to price gaps and increased volatility when the market opens. This can be particularly challenging for traders who rely on technical analysis.
  4. Overtrading and Emotional Bias – The high frequency of news releases and the potential for large price swings can lead some traders to overtrade or make impulsive decisions based on emotion rather than analysis.
  5. High Volatility and Liquidity – Major news events can cause spikes in volatility and liquidity, which can make it difficult to execute trades at desired prices or to exit positions in a timely manner.
  6. Trading Costs – The costs of executing trades, such as spreads and commissions, can be higher during news events due to increased volatility and liquidity.
  7. Political and Geopolitical Risk – Forex news can be influenced by political events, such as elections, policy changes, and conflicts. These factors can be unpredictable and difficult to quantify, adding to the risk of forex trading.
  8. Limited Control Over Market Events – Traders have little control over the economic events and data releases that can impact forex markets, which can make it difficult to manage risk.
  9. Technical Issues – Technology disruptions, such as internet outages or platform malfunctions, can prevent traders from executing trades or accessing information during critical market events.
  10. Legal and Regulatory Risks – Forex trading is subject to legal and regulatory requirements, which can vary by jurisdiction. Traders must ensure compliance with applicable laws and regulations, which can add complexity and risk to trading activities.

Conclusion

Forex news can have a significant impact on the foreign exchange market, and trading based on forex news can be a profitable strategy for experienced traders. To trade forex news like a pro, traders should stay informed, use technical analysis, manage risk, keep a trading plan, and be patient. Additionally, traders should be aware of the timing of forex news events, including interest rate decisions by central banks, economic data releases, political events, and natural disasters, and be prepared for potential market movements in response to these events.


Trading Forex with the News: A Comprehensive Guide for Beginners in 2023

trading Forex with the news

Introduction

trading Forex with the news

The Forex market is a highly dynamic and complex market that operates 24 hours a day, five days a week. It is a market where currencies are traded and prices are determined based on the supply and demand of each currency. The market is highly influenced by a variety of factors such as interest rates, economic data, geopolitical events, and most importantly, news events.

Trading news events in the Forex market can be a highly profitable strategy, as long as you know how to do it correctly. This article will provide a comprehensive guide on how to trade Forex with the news, including the most important news events to look out for, how to trade news events, and what to look for when choosing a Forex news site.

How to Trade Forex News Events

When it comes to

, there are two main approaches: trading the news itself or trading the market reaction to the news.

Trading forex with the News: This approach involves entering a trade just before the news is released, taking advantage of the volatility that the news is likely to cause. This strategy is best used for high-impact news events, such as the Non-Farm Payrolls (NFP) or Consumer Price Index (CPI) releases.

Trading the Market Reaction: This approach involves waiting for the market to react to the news, then entering a trade based on the direction of the price move. This strategy is best used for low-impact news events, such as minor economic releases or geopolitical events.

When trading Forex with the news events, it is important to have a clear understanding of what the news means, and how it is likely to impact the market. This information can be found in the economic calendar, which lists all the important economic releases and events, and the expected impact of each one.

What to Look for When Choosing a Forex News Site

Forex news sites are an essential resource for traders looking to stay up-to-date on the latest news and events affecting the global currency markets. With so many forex news sites available, it can be challenging to know which ones to trust and which ones to avoid. Here are some key factors to consider when choosing a forex news site:

  1. Credibility: The credibility of a forex news site is perhaps the most important factor to consider. You want to choose a site that is reputable and reliable, and that provides accurate and timely information. Look for sites that have been in operation for a significant amount of time and that have a track record of providing high-quality content.
  2. Timeliness: In the forex markets, timing is everything. You want to choose a news site that provides up-to-the-minute information on breaking news and events that could impact currency prices. Look for sites that update their content frequently and that provide real-time news feeds and alerts.
  3. Range of coverage: The forex markets are complex and interconnected, so it’s important to choose a news site that covers a wide range of topics and regions. Look for sites that cover major currency pairs and emerging markets, as well as global economic and political events that could impact currency prices.
  4. Analysis and commentary: In addition to providing news and updates, the best forex news sites also provide in-depth analysis and commentary on market trends and events. Look for sites that offer expert opinions and insights from experienced traders and analysts, as well as tools and resources for conducting your own analysis.
  5. Usability: A good forex news site should be easy to navigate and use. Look for sites that have a clean and intuitive design, with clear and concise headlines and summaries. The site should also be optimized for mobile devices, so that you can access news and updates on the go.
  6. Free vs. Paid: Many forex news sites are free, while others require a subscription or membership fee. Consider whether you’re willing to pay for premium content, and whether the additional features and resources offered by a paid site are worth the investment.
  7. Reputation: Finally, consider the reputation of the forex news site you’re considering. Look for reviews and ratings from other traders and investors, and do your own research to ensure that the site has a positive track record and is well-regarded within the industry.

Choosing a forex news site requires careful consideration of a range of factors, including credibility, timeliness, range of coverage, analysis and commentary, usability, free vs. paid options, and reputation. By selecting a high-quality forex news site, traders can stay informed and make more informed trading decisions in the fast-moving global currency

Some of the best Forex news sites include  Investing.com, Reuters, forexlive, bloomberg Forex Factory, DailyFX, and FXStreet, all of which provide up-to-date news, analysis, and market insights.

Some of the popular websites for forex news include:

Investing.com

Investing.com is a leading financial news and research website that provides up-to-date information on global financial markets, including the foreign exchange (Forex) market. It offers a wide range of resources and tools for traders, investors, and market enthusiasts, including real-time news and analysis, technical analysis, economic calendars, and market data on a variety of financial instruments, including Forex, stocks, commodities, indices, and cryptocurrencies.

One of the key features of Investing.com is its comprehensive Forex section, which provides real-time quotes, charts, and technical analysis tools, as well as in-depth market analysis and commentary from a team of experienced Forex analysts. The site also provides Forex traders with a wide range of tools, including an economic calendar that tracks key economic data releases, a pip calculator that helps traders to calculate their potential profits and losses, and a currency converter that enables traders to convert between different currencies.

Investing.com also offers a mobile app for both Android and iOS, allowing users to stay up-to-date with the latest market news and analysis, even when they are on the go. The app provides real-time quotes and charts, as well as push notifications for breaking news and market events.

Overall, Investing.com is a highly-regarded resource for traders and investors looking for reliable and up-to-date information on the Forex market. With its comprehensive range of tools and resources, Investing.com is an excellent choice for those looking to stay informed and make informed investment decisions in the Forex market.

trading Forex with the news

Forex Factory

Forex Factory is a popular online resource for Forex traders, offering a wide range of information and tools for traders and market enthusiasts. The site provides a centralized hub for Forex traders to access real-time news and analysis, as well as forums and discussions where traders can share their insights and experiences with other traders.

Forex Factory provides a wealth of information for Forex traders, including an economic calendar that tracks key economic data releases, technical analysis tools, and real-time Forex quotes and charts. The site also offers in-depth market analysis and commentary from a team of experienced Forex analysts, as well as a Forex forum where traders can discuss the market, share their trading strategies, and get feedback from other traders.

Forex Factory is well known for its calendar, which provides a comprehensive view of upcoming economic events, including central bank announcements, government reports, and other market-moving events. The calendar allows traders to stay informed of upcoming events that may affect the Forex market, and to make informed trading decisions based on this information.

In addition to its comprehensive range of tools and resources, Forex Factory also offers a mobile app for both Android and iOS, allowing users to access the latest market news and analysis, even when they are on the go.

Overall, Forex Factory is a comprehensive resource for Forex traders, providing a centralized hub for traders to access real-time news, analysis, and discussion, as well as a wide range of tools and resources to help traders make informed trading decisions

DailyFX

DailyFX is a leading online resource for Forex traders, offering real-time news, analysis, and educational resources to help traders make informed decisions in the Forex market. The site provides in-depth market analysis and commentary from a team of experienced Forex analysts, as well as real-time Forex quotes and charts.

One of the key features of DailyFX is its educational section, which provides a wide range of resources and tools to help traders improve their understanding of the Forex market. This includes in-depth articles and videos on technical analysis, fundamental analysis, and trading strategies, as well as a Forex trading course that provides step-by-step guidance for traders at all levels.

In addition to its educational resources, DailyFX also provides an economic calendar that tracks key economic data releases, and a Forex news section that provides real-time news and analysis on market-moving events. The site also offers a range of technical analysis tools, including real-time charts and analysis, to help traders make informed trading decisions based on market trends and technical indicators.

DailyFX also provides a mobile app for both Android and iOS, allowing users to stay up-to-date with the latest market news and analysis, even when they are on the go. The app provides real-time quotes, charts, and news alerts, as well as access to the site’s educational resources and tools.

Overall, DailyFX is a comprehensive resource for Forex traders, providing real-time news and analysis, as well as a wide range of educational resources and tools to help traders make informed trading decisions in the Forex market.

Reuters

Reuters is a global news and information company that provides up-to-date news and analysis on financial markets, including the foreign exchange (Forex) market. The company has a strong reputation for delivering accurate, reliable, and timely information, and is widely regarded as one of the most trusted sources of financial news and analysis.

Reuters provides Forex traders with real-time quotes and charts, as well as in-depth market analysis and commentary from its team of experienced Forex analysts. The site also provides an economic calendar that tracks key economic data releases, and a Forex news section that provides real-time news and analysis on market-moving events.

In addition to its Forex coverage, Reuters also provides news and analysis on a wide range of financial markets, including stocks, commodities, and indices, as well as business and economic news from around the world. The site also offers a range of tools and resources for traders and investors, including market data and portfolio management tools.

Overall, Reuters is an excellent resource for Forex traders who are looking for up-to-date news and analysis on the Forex market, as well as a range of resources and tools to help them make informed trading decisions. The company’s reputation for delivering accurate and reliable information makes it a trusted source of information for traders and investors alike.

Bloomberg

Bloomberg is a leading provider of financial news and analysis, offering comprehensive coverage of the global financial markets, including the foreign exchange (Forex) market. The company is known for its high-quality, in-depth analysis and reporting, and is widely regarded as a trusted source of financial news and information.

Bloomberg provides Forex traders with real-time quotes, charts, and news alerts, as well as in-depth market analysis and commentary from its team of experienced Forex analysts. The site also provides an economic calendar that tracks key economic data releases, and a Forex news section that provides real-time news and analysis on market-moving events.

In addition to its Forex coverage, Bloomberg provides news and analysis on a wide range of financial markets, including stocks, commodities, and bonds, as well as business and economic news from around the world. The site also offers a range of tools and resources for traders and investors, including market data, portfolio management tools, and trading and investment strategies.

One of the key features of Bloomberg is its Bloomberg Terminal, a powerful tool for financial professionals that provides real-time financial data, news, and analysis. The Terminal is widely used by traders, investors, and financial institutions around the world and offers a range of features and tools designed to help traders make informed trading decisions.

Overall, Bloomberg is an excellent resource for Forex traders who are looking for in-depth news and analysis on the Forex market, as well as a range of resources and tools to help them make informed trading decisions. The company’s reputation for delivering accurate and reliable information makes it a trusted source of information for traders and investors alike.

ForexLive

ForexLive is a leading online resource for Forex traders, offering real-time news, analysis, and commentary on the foreign exchange (Forex) market. The site is designed to provide traders with the information and tools they need to make informed trading decisions, and is widely regarded as one of the most comprehensive resources for Forex traders.

ForexLive provides real-time Forex quotes and charts, as well as in-depth market analysis and commentary from its team of experienced Forex analysts. The site also provides an economic calendar that tracks key economic data releases, and a Forex news section that provides real-time news and analysis on market-moving events.

One of the key features of ForexLive is its focus on real-time analysis and commentary. The site provides up-to-the-minute analysis and commentary on the Forex market, allowing traders to stay informed and make informed trading decisions in real-time. The site’s team of experienced Forex analysts also provide regular technical analysis, helping traders understand the trends and patterns that are shaping the Forex market.

ForexLive also provides a range of educational resources and tools to help traders improve their understanding of the Forex market. This includes in-depth articles and videos on technical analysis, fundamental analysis, and trading strategies, as well as a Forex trading course that provides step-by-step guidance for traders at all levels.

Overall, ForexLive is a comprehensive resource for Forex traders, offering real-time news and analysis, as well as a range of educational resources and tools to help traders make informed trading decisions in the Forex market. The site’s focus on real-time analysis and commentary makes it an essential resource for traders who are looking to stay informed and make informed trading decisions in real-time.

FXStreet

FXStreet is a popular forex news and analysis website that provides traders with real-time news and analysis on the global currency markets. The site was launched in 2000 and has since become one of the most trusted and respected sources of forex news and analysis.

One of the key features of FXStreet is its wide range of coverage. The site provides news and analysis on major currency pairs, emerging markets, and global economic and political events that could impact currency prices. The site also offers technical analysis tools and charts, as well as a calendar of upcoming economic events and releases.

FXStreet has a team of experienced analysts and traders who provide in-depth analysis and commentary on market trends and events. The site also offers a forum where traders can share ideas and insights with one another, as well as a news feed and alerts that keep traders informed of breaking news and events in real-time.

FXStreet is known for its user-friendly interface and design, which makes it easy for traders to navigate and find the information they need. The site is optimized for mobile devices, allowing traders to access news and updates on the go.

In addition to its free content, FXStreet also offers premium services, including a live trading room, trading signals, and a comprehensive trading course. These services are designed to provide traders with the tools and resources they need to make informed trading decisions and succeed in the global currency markets.

Overall, FXStreet is a valuable resource for traders looking for reliable and up-to-date news and analysis on the global currency markets. The site’s wide range of coverage, experienced analysts, and user-friendly interface make it a top choice for traders around the world.

trading Forex with the news

What is CPI News in Forex

The Consumer Price Index (CPI) is a key economic indicator that measures the change in the price of goods and services consumed by households. It is a highly influential indicator, as it provides insight into inflationary pressures in the economy, which can impact interest rates and currency values.

The release of the CPI is considered a high-impact news event in the Forex market, and can cause significant volatility in the market. Traders who are trading Forex with the news should pay close attention to the release of the CPI, as it can provide opportunities for profitable trades.

What is NFP News in Forex

The Non-Farm Payrolls (NFP) is a key economic indicator that measures the change in the number of employed people in the U.S. economy, excluding farm workers, government employees, and private household employees. It is considered one of the most important news releases in the Forex market, as it provides a snapshot of the health of the U.S. labor market, and is closely watched by investors and traders.

The NFP release is considered a high-impact news event in the Forex market, and can cause significant volatility in the market. Traders who are trading Forex with the news should pay close attention to the release of the NFP, as it can provide opportunities for profitable trades.

What is High Impact News in Forex

High impact news events in Forex refer to news releases and events that are expected to have a significant impact on the market. These events are usually closely watched by traders and investors, as they can cause significant volatility in the market and provide opportunities for profitable trades.

Some of the most important high impact news events in Forex include interest rate decisions, monetary policy statements, economic data releases such as GDP, and major geopolitical events such as elections and wars.

What is News Trading in Forex

News trading in Forex refers to the practice of trading based on news events and their expected impact on the market. This can involve trading the news itself, or trading the market reaction to the news.

News trading can be a highly profitable strategy, as long as you have a clear understanding of what the news means and how it is likely to impact the market. It is important to keep up-to-date with the latest news and events, and to have a well-defined trading plan that takes into account the potential volatility caused by the news.

What is the Most Important News in Forex

The most important news in Forex can vary depending on the current market conditions and the currency pair being traded. However, some of the most important news events in Forex include:

  • Interest rate decisions by central banks
  • Monetary policy statements
  • Economic data releases such as GDP, inflation, and employment data
  • Major geopolitical events such as elections and wars

It is important to keep up-to-date with all the latest news and events in the Forex market, and to have a clear understanding of what each news event means and how it is likely to impact the market.

What is the Latest News on MBA Forex

MBA Forex is a Nigerian-based Forex trading company that has been in operation for several years. It has recently been in the news for various reasons, including allegations of fraud and mismanagement.

It is important to thoroughly research any Forex trading company before investing, including checking for any red flags or negative news. It is also important to be aware of the potential risks involved in Forex trading, and to only invest what you can afford to lose.

What is PPI News in Forex

The Producer Price Index (PPI) is a key economic indicator that measures the change in the price of goods and services produced by manufacturers. It provides insight into inflationary pressures in the economy, which can impact interest rates and currency values.

The release of the PPI is considered a high-impact news event in the Forex market, and can cause significant volatility in the market. Traders who are trading Forex with the news should pay close attention to the release of the PPI, as it can provide opportunities for profitable trades.

What Time is Forex News

Forex news events are released at various times throughout the day, with the majority of important news events taking place during the European and U.S. trading sessions. The specific time of each news event can be found in the economic calendar, which lists all the important economic releases and events and their expected impact.

It is important to pay close attention to the time of the news release, as this is when the market is most likely to experience volatility. Some important news events, such as interest rate decisions and monetary policy statements, are released at set times, while others, such as economic data releases, can be released at any time.

In order to stay on top of the latest Forex news, it is important to regularly check the economic calendar and to set up notifications for the most important news releases. This will ensure that you are well-informed and ready to take advantage of any opportunities that may arise from the news events.

Is Trading Forex With the News a Better strategy?

Trading forex with the news is a popular strategy used by many traders to take advantage of the impact of economic and political events on currency prices. Here are some tips for trading forex with the news all aspiring traders should do or know.

  1. Follow a forex news calendar: One of the most important aspects of trading forex with the news is staying up-to-date on upcoming economic and political events that could impact currency prices. Many forex news sites offer a calendar of upcoming events, such as interest rate announcements, employment reports, and other economic indicators.
  2. Understand the impact of the news: Not all news events will impact currency prices in the same way. For example, positive economic data from a country could boost its currency, while political instability could cause its currency to weaken. It’s important to understand the potential impact of each news event on the currency markets.
  3. Use technical analysis: While news events can impact currency prices in the short term, technical analysis can help identify longer-term trends and potential entry and exit points. Traders should use a combination of news analysis and technical analysis to make informed trading decisions.
  4. Be prepared for volatility: News events can create volatility in the forex markets, which can lead to sudden price swings and increased risk. Traders should be prepared for these events and use risk management tools, such as stop-loss orders and position sizing, to limit their exposure.
  5. Consider trading with a forex news strategy: Some traders use specific trading strategies that are designed to take advantage of news events. For example, a news-based trading strategy may involve entering a position before an economic release and then exiting the position shortly after the release, based on the market’s reaction to the news.

Trading forex with the news can be a profitable strategy for traders who understand the potential impact of economic and political events on currency prices. By staying up-to-date on news events, using technical analysis, and managing risk, traders can make informed trading decisions and succeed in the dynamic and fast-paced world of forex trading.

Conclusion

Trading Forex with the news can be a highly profitable strategy, as long as you have a clear understanding of what the news means and how it is likely to impact the market. It is important to keep up-to-date with all the latest news and events in the Forex market, and to have a well-defined trading plan that takes into account the potential volatility caused by the news.

Whether you are a beginner or an experienced trader, it is always a good idea to seek out education and training in Forex trading, and to continually develop your knowledge and skills. By doing so, you can increase your chances of success and achieve your Forex trading goals.


Understanding Donchian Channels Strategy: A Technical Analysis Tool for Traders in 2023

Introduction

Donchian Channels strategy

Donchian Channels are a popular technical analysis tool used by traders to identify potential breakouts and trend reversals in the market. They are named after their creator, Richard Donchian, who is considered to be one of the pioneers of modern trend following.

In this comprehensive guide, we will delve deep into the concept of Donchian Channels strategy, how they work, and the various ways they can be used to make informed trading decisions.

What are Donchian Channels?

Donchian Channels are a technical analysis tool used to identify the current trend and potential trading opportunities in financial markets. The channels are named after their creator, Richard Donchian, who was a pioneer in the field of trend following trading.

Donchian Channels strategy consist of three lines: the upper channel line, the lower channel line, and the median line. The upper channel line is drawn by connecting the highest high over a certain period of time, such as 20 or 30 days. The lower channel line is drawn by connecting the lowest low over the same period of time. The median line is simply the midpoint between the upper and lower channel lines.

The concept behind Donchian Channels strategy is that they help traders identify the current trend of a market. When prices are above the upper channel line, the trend is considered to be bullish, and when prices are below the lower channel line, the trend is considered to be bearish. Traders can use this information to make trading decisions, such as entering a long position when prices break above the upper channel line or entering a short position when prices break below the lower channel line.

In addition to identifying the trend, Donchian Channels strategy can also be used to identify potential support and resistance levels. The upper and lower channel lines can act as levels of resistance and support, respectively, and traders can use these levels to place stop-loss orders or to take profits.

Overall, Donchian Channels strategy are a popular and useful technical analysis tool for traders looking to identify trends and potential trading opportunities in financial markets.

Components of Donchian Channels Strategy

Donchian Channels are a technical analysis tool that consists of three main components: the upper channel line, the lower channel line, and the median line. These lines are drawn on a price chart using the highest high and lowest low over a certain lookback period, which is the number of trading days or periods used in the calculation. Here are more details about each component of Donchian Channels:

  1. Upper channel line: The upper channel line is drawn by connecting the highest high over the lookback period. It represents the maximum price that the market has reached during the chosen time frame. The upper channel line is used as a level of resistance and can be seen as an indicator of the strength of the bullish trend.
  2. Lower channel line: The lower channel line is drawn by connecting the lowest low over the lookback period. It represents the minimum price that the market has reached during the chosen time frame. The lower channel line is used as a level of support and can be seen as an indicator of the strength of the bearish trend.
  3. Median line: The median line is simply the midpoint between the upper and lower channel lines. It represents the average price of the market over the chosen time frame. The median line is not used as a level of support or resistance, but rather as a reference point to help traders interpret the price action within the channels.
  4. Lookback period: The lookback period is the number of trading days or periods used in the calculation of the highest high and lowest low. It can be adjusted based on the trader’s preference and the time frame they are using for analysis. For example, a 20-day lookback period may be used for short-term trading, while a 50-day lookback period may be used for longer-term trading.

Donchian Channels strategy consist of the upper and lower channel lines, the median line, and the lookback period. These components are used to identify the current trend, potential support and resistance levels, and trading opportunities in financial markets.

Donchian Channels strategy

Importance of Donchian Channels in technical analysis

Donchian Channels strategy are an important tool in technical analysis for several reasons. Here are some of the key reasons why Donchian Channels are important for traders and investors:

  1. Trend identification: One of the primary functions of Donchian Channels is to identify the current trend of a market. This is an essential aspect of technical analysis, as traders rely on trend identification to make informed decisions about when to enter or exit positions. Donchian Channels provide a simple and effective way to identify the direction of the trend, which is critical for successful trading.
  2. Support and resistance levels: In addition to identifying the trend, Donchian Channels strategy can also be used to identify potential support and resistance levels. These levels can be used by traders to place stop-loss orders or to take profits, as they represent areas where the price may experience a reversal or consolidation. The ability to identify support and resistance levels is crucial for effective risk management and for maximizing trading profits.
  3. Compatibility with multiple time frames: Donchian Channels can be used on any time frame, from short-term intraday charts to longer-term daily or weekly charts. This means that traders can use Donchian Channels to analyze a wide range of markets and trading styles. The ability to use the tool across multiple time frames provides traders with a high degree of flexibility and adaptability, which is essential in fast-moving and ever-changing financial markets.
  4. Easy to understand and use: Donchian Channels are a relatively simple and easy-to-use tool, which makes them accessible to traders of all levels of experience. The simplicity of the tool means that traders can quickly grasp the concept and start applying it to their trading strategies.
  5. Compatibility with other technical indicators: Donchian Channels strategy can be used in conjunction with other technical indicators to confirm signals and improve the accuracy of trading decisions. This compatibility with other indicators means that traders can use Donchian Channels as part of a more comprehensive technical analysis toolkit.

Donchian Channels are an important tool in technical analysis because they help traders identify trends, support and resistance levels, and potential trading opportunities. Their compatibility with multiple time frames and other technical indicators makes them a versatile and powerful tool for traders of all levels of experience.

How do Donchian Channels work?

Donchian Channels are a popular technical analysis tool used to identify the current trend and potential trading opportunities in financial markets. The channels are named after their creator, Richard Donchian, who was a pioneer in the field of trend following trading.

Donchian Channels consist of three lines: the upper channel line, the lower channel line, and the median line. The upper channel line is drawn by connecting the highest high over a certain period of time, such as 20 or 30 days. The lower channel line is drawn by connecting the lowest low over the same period of time. The median line is simply the midpoint between the upper and lower channel lines.

The concept behind Donchian Channels is that they help traders identify the current trend of a market. When prices are above the upper channel line, the trend is considered to be bullish, and when prices are below the lower channel line, the trend is considered to be bearish. Traders can use this information to make trading decisions, such as entering a long position when prices break above the upper channel line or entering a short position when prices break below the lower channel line.

In addition to identifying the trend, Donchian Channels can also be used to identify potential support and resistance levels. The upper and lower channel lines can act as levels of resistance and support, respectively, and traders can use these levels to place stop-loss orders or to take profits.

It’s important to note that like any technical analysis tool, Donchian Channels have limitations and are not foolproof. It’s always a good idea to use other indicators and analysis techniques to confirm the signals provided by Donchian Channels before making any trading decisions.

Donchian Channels strategy

How to Use Donchian Channels

Donchian Channels are a technical analysis tool that can be used to identify the current trend, potential support and resistance levels, and trading opportunities in financial markets. Here is a step-by-step guide on how to use Donchian Channels:

  1. Determine the lookback period: The first step in using Donchian Channels is to determine the lookback period, which is the number of trading days or periods over which the highest high and lowest low will be calculated. Common lookback periods include 20, 30, or 50 days, but you can adjust this based on your trading style and the time frame you are using.
  2. Plot the channels: Once you have determined the lookback period, you can plot the Donchian Channels on your charting software. The upper channel line is drawn by connecting the highest high over the lookback period, and the lower channel line is drawn by connecting the lowest low over the same period. The median line is simply the midpoint between the upper and lower channel lines.
  3. Identify the trend: The primary use of Donchian Channels is to identify the trend of the market. When prices are trading above the upper channel line, the trend is considered to be bullish, and when prices are trading below the lower channel line, the trend is considered to be bearish.
  4. Look for breakouts: Traders can use Donchian Channels to identify potential trading opportunities when prices break out of the channel. For example, if prices have been trading within the channel for a period of time and then break above the upper channel line, this could be a signal to enter a long position. Conversely, if prices break below the lower channel line, this could be a signal to enter a short position.
  5. Use the channels as support and resistance levels: The upper and lower channel lines can also act as levels of support and resistance. Traders can use these levels to place stop-loss orders or to take profits. For example, if you have entered a long position based on a breakout above the upper channel line, you may want to place a stop-loss order just below the upper channel line in case prices move back within the channel.
  6. Combine with other indicators: Donchian Channels are a useful tool on their own, but they can be even more powerful when combined with other technical indicators such as moving averages, relative strength index (RSI), or Bollinger Bands. Traders can use these indicators to confirm signals provided by the Donchian Channels and improve the accuracy of their trading decisions.

Donchian Channels are a versatile technical analysis tool that can be used to identify trends, potential support and resistance levels, and trading opportunities. By following the steps outlined above and using them in conjunction with other indicators, traders can make more informed trading decisions and improve their chances of success in the markets.

Advantages of Donchian Channels

Donchian Channels have several advantages as a technical analysis tool for traders. Here are some of the key advantages of using Donchian Channels:

  1. Simple and easy to use: Donchian Channels are relatively easy to understand and use, making them a good tool for traders who are new to technical analysis. The concept of identifying the highest high and lowest low over a given period of time and drawing lines based on those values is straightforward and can be applied to any financial market.
  2. Helps identify trends: The primary purpose of Donchian Channels strategy is to identify the current trend of the market. When prices are trading above the upper channel line, the trend is considered to be bullish, and when prices are trading below the lower channel line, the trend is considered to be bearish. Traders can use this information to make more informed trading decisions and enter positions in the direction of the trend.
  3. Provides potential support and resistance levels: In addition to identifying the trend, Donchian Channels can also be used to identify potential levels of support and resistance. The upper and lower channel lines can act as levels of resistance and support, respectively, and traders can use these levels to place stop-loss orders or to take profits.
  4. Works across multiple time frames: Donchian Channels strategy can be used on any time frame, from short-term intraday charts to longer-term daily or weekly charts. This versatility allows traders to apply the tool to a wide range of markets and trading styles.
  5. Can be used in conjunction with other indicators: Donchian Channels can be used in combination with other technical indicators, such as moving averages or relative strength index (RSI), to confirm signals and improve the accuracy of trading decisions.

Donchian Channels strategy offer several advantages to traders, including ease of use, trend identification, support and resistance levels, compatibility with multiple time frames, and the ability to be used in combination with other indicators.

Disadvantages of Donchian Channels strategy

While Donchian Channels can be a useful tool for traders, it is important to be aware of their limitations. Some of the main limitations of Donchian Channels strategy include:

  1. Lagging Indicator

One of the main limitations of Donchian Channels strategy is that they are a lagging indicator, meaning that they are based on past prices. This means that they may not always be accurate in predicting future price movements. Traders should be aware that past performance is not necessarily indicative of future results.

  1. Whipsaw Effect

Donchian Channels strategy can also be susceptible to the whipsaw effect. This occurs when the price of an asset briefly breaks above or below the upper or lower band, but then quickly reverses back into the range. This can result in false breakouts, which can lead to losses for traders.

  1. Incomplete Picture

Another limitation of Donchian Channels strategy is that they only provide a limited picture of the market. They do not take into account other important factors, such as market fundamentals or news events, which can have a significant impact on the price of an asset.

  1. Not Suitable for All Market Conditions

Donchian Channels strategy are also not suitable for all market conditions. They are best used in trending markets, and may not be as effective in range-bound markets. Traders should be aware of the prevailing market conditions and adjust their trading strategy accordingly.

  1. Over-Reliance

Finally, one of the biggest limitations of Donchian Channels strategy  is over-reliance. Traders should not rely solely on Donchian Channels strategy for making trading decisions. They should also use other technical analysis tools and indicators, as well as fundamental analysis, to make informed trading decisions.

Conclusion

Donchian Channels are a popular technical analysis tool used by traders to identify potential breakouts and trend reversals in the market. They are based on the idea that markets tend to trend and that trends are more likely to continue than to reverse.

Traders can use these Donchian Channels strategy in a number of ways to make informed trading decisions, including identifying breakouts, identifying trend reversals, identifying potential levels of support and resistance, using other indicators, and using multiple timeframes.

As with any trading indicator, Donchian Channels strategy  should be used in conjunction with other technical analysis tools and indicators to make informed trading decisions. Traders should also be aware of the limitations of Donchian Channels strategy  and should use them in combination with other analysis techniques to maximize their trading success.


Discovering the Best ECN Forex Brokers in Kenya: A Guide for Investors in 2023

Introduction

Are you a  trader looking for the best ECN Forex brokers in Kenya? Look no further! ECN Forex brokers, short for electronic communication network, offer traders direct access to the interbank market with transparent pricing and lower spreads. In this guide, we will explore the top ECN Forex brokers in Kenya, the factors to consider when choosing a broker, and provide a comparison of the spreads and fees offered by each. Join us as we guide you through the process of discovering the best ECN Forex brokers in Kenya for your trading needs.

ECN Forex brokers in Kenya

Understanding ECN Forex Brokers in Kenya

ECN Forex brokers in Kenya, or electronic communication network brokers, are a popular choice among traders in Kenya due to their transparent pricing and direct access to the interbank market. Unlike traditional brokers, ECN Forex brokers do not act as a counterparty to trades, instead, they match buyers and sellers in real time to provide the best possible prices.

However, not all ECN Forex brokers in Kenya are created equal. It is important to thoroughly research and compare different options before choosing a broker. In this guide, we will explore the factors to consider when selecting the best ECN Forex brokers in Kenya for your trading needs.

One of the most important factors to consider is regulation and licensing. It is crucial to choose a broker that is regulated by a reputable authority, such as the Capital Markets Authority (CMA) in Kenya, to ensure the safety of your funds. Additionally, it is also important to consider the platforms and tools offered by the broker, as well as their spreads and fees. Quality customer service and support is also crucial factor, as they will be your main point of contact in case of any issues or questions.

Types of the ECN Forex Brokers in Kenya

The two main types of ECN brokers in Kenya; True ECN brokers and ECN/STP brokers.

  1. True ECN Brokers: True ECN brokers provide direct access to the interbank market, allowing traders to trade directly with other market participants, including banks, hedge funds, and other large institutions. True ECN brokers do not act as a market maker, and they do not take the other side of a trader’s trade. Instead, they simply connect traders to the interbank market and provide them with the best available bid and ask prices.

Examples of True ECN brokers in Kenya include:

  • Pepperstone
  • IC Markets
  • AxiTrader
  1. ECN/STP Brokers: ECN/STP brokers, on the other hand, provide access to the interbank market through a Straight Through Processing (STP) model. This means that the broker acts as an intermediary between the trader and the interbank market, and the broker takes a small commission on each trade. ECN/STP brokers do not act as market makers, and they do not take the other side of a trader’s trade. Instead, they simply connect traders to the interbank market and provide them with the best available bid and ask prices.

Examples of ECN/STP brokers include:

  • FxPro
  • Forex.com
  • Oanda

Both True ECN brokers and ECN/STP brokers offer traders access to the interbank market, low spreads, fast execution speeds, and deep liquidity. The main difference between the two is the way in which they provide access to the interbank market, with True ECN brokers providing direct access and ECN/STP brokers providing access through a Straight Through Processing model. Both types of ECN brokers in Kenya are a popular choice for traders who are looking for competitive trading conditions and low costs.

Top ECN Forex Brokers in Kenya

FXTM ECN Forex Broker  in Kenya

FXTM, also known as ForexTime, is a well-regarded online Forex and CFD broker that operates globally, with a strong presence in Kenya. The broker was founded in 2011 and is headquartered in Cyprus. It is regulated by the Financial Conduct Authority (FCA) in the UK and the Cyprus Securities and Exchange Commission (CySEC).

FXTM offers a range of financial instruments for trading, including forex, commodities, indices, and stocks. The broker provides traders with access to deep liquidity through its ECN network, and traders can take advantage of low spreads and fast execution speeds.

One of the standout features of FXTM is its range of trading platforms, which includes the popular MetaTrader 4 and MetaTrader 5 platforms. The broker also offers a web-based platform, as well as mobile trading apps for Android and iOS devices. This provides traders with flexibility and convenience, as they can trade from anywhere and at any time.

FXTM also offers a range of educational resources, including market analysis, market news, and educational materials. The broker provides traders with a range of tools and features to help them make informed trading decisions, including expert advisors, technical indicators, and charting tools.

In terms of customer support, FXTM offers 24/7 support via phone, email, and live chat. The broker’s customer support team is knowledgeable and responsive, and traders can get help with any questions or issues they may have.

FXTM is a well-regarded and reliable ECN broker that offers a range of trading instruments, low spreads, fast execution speeds, and deep liquidity. The broker is regulated by the FCA and CySEC, and provides traders with a range of trading platforms, educational resources, and customer support. These factors make FXTM a top choice for Forex and CFD traders in Kenya.

ECN Forex brokers in Kenya

OctaFX ECN Forex Broker  in Kenya

OctaFX is a leading online Forex and CFD broker that operates globally, including in Kenya. The broker was founded in 2011 and is headquartered in Saint Vincent and the Grenadines. It is regulated by the Financial Services Authority (FSA) of Saint Vincent and the Grenadines.

OctaFX offers a range of financial instruments for trading, including forex, commodities, indices, and stocks. The broker provides traders with access to deep liquidity through its ECN network, and traders can take advantage of low spreads and fast execution speeds.

One of the key features of OctaFX is its range of trading platforms, which includes the popular MetaTrader 4 platform. The broker also offers a web-based platform, as well as mobile trading apps for Android and iOS devices. This provides traders with flexibility and convenience, as they can trade from anywhere and at any time.

OctaFX also offers a range of educational resources, including market analysis, market news, and educational materials. The broker provides traders with a range of tools and features to help them make informed trading decisions, including technical indicators, charting tools, and a range of trading tools.

In terms of customer support, OctaFX offers 24/7 support via phone, email, and live chat. The broker’s customer support team is knowledgeable and responsive, and traders can get help with any questions or issues they may have.

OctaFX is a reliable and well-regarded ECN broker that offers a range of trading instruments, low spreads, fast execution speeds, and deep liquidity. The broker is regulated by the FSA of Saint Vincent and the Grenadines, and provides traders with a range of trading platforms, educational resources, and customer support. These factors make OctaFX a top choice for Forex and CFD traders in Kenya.

IC Markets ECN Forex Broker  in Kenya

 IC Markets is a leading online Forex and CFD broker that operates globally, including in Kenya. The broker was founded in 2007 and is headquartered in Sydney, Australia. It is regulated by the Australian Securities and Investments Commission (ASIC).

IC Markets offers a range of financial instruments for trading, including forex, commodities, indices, and stocks. The broker provides traders with access to deep liquidity through its ECN network, and traders can take advantage of low spreads and fast execution speeds.

One of the standout features of IC Markets is its range of trading platforms, which includes the popular MetaTrader 4 and cTrader platforms. The broker also offers a range of advanced trading tools and features, including expert advisors, technical indicators, and charting tools. This provides traders with the tools and features they need to make informed trading decisions.

IC Markets also offers a range of educational resources, including market analysis, market news, and educational materials. The broker provides traders with a range of tools and features to help them make informed trading decisions, including technical indicators, charting tools, and a range of trading tools.

In terms of customer support, IC Markets offers 24/7 support via phone, email, and live chat. The broker’s customer support team is knowledgeable and responsive, and traders can get help with any questions or issues they may have.

IC Markets is a reliable and well-regarded ECN broker that offers a range of trading instruments, low spreads, fast execution speeds, and deep liquidity. The broker is regulated by ASIC, and provides traders with a range of trading platforms, educational resources, and customer support. These factors make IC Markets a top choice for Forex and CFD traders in Kenya.

XM Group ECN Forex Brokers  in Kenya

XM Group  is a well-established online Forex and CFD broker that operates globally, including in Kenya. The broker was founded in 2009 and is headquartered in Limassol, Cyprus. It is regulated by the Australian Securities and Investments Commission (ASIC) and the Financial Conduct Authority (FCA) in the UK.

XM Group offers a range of financial instruments for trading, including forex, commodities, indices, and stocks. The broker provides traders with access to deep liquidity through its ECN network, and traders can take advantage of low spreads and fast execution speeds.

One of the standout features of XM Group is its range of trading platforms, which includes the popular MetaTrader 4 and MetaTrader 5 platforms. The broker also offers a range of advanced trading tools and features, including expert advisors, technical indicators, and charting tools. This provides traders with the tools and features they need to make informed trading decisions.

XM Group also offers a range of educational resources, including market analysis, market news, and educational materials. The broker provides traders with a range of tools and features to help them make informed trading decisions, including technical indicators, charting tools, and a range of trading tools.

In terms of customer support, XM Group offers 24/7 support via phone, email, and live chat. The broker’s customer support team is knowledgeable and responsive, and traders can get help with any questions or issues they may have.

XM Group is a well-established and reliable ECN broker that offers a range of trading instruments, low spreads, fast execution speeds, and deep liquidity. The broker is regulated by ASIC and the FCA, and provides traders with a range of trading platforms, educational resources, and customer support. These factors make XM Group a top choice for Forex and CFD traders in Kenya.

ECN Forex brokers in Kenya

HotForex ECN Forex Brokers in Kenya

HotForex: is a popular online Forex and CFD broker that operates globally, including in Kenya. The broker was founded in 2010 and is headquartered in Mauritius. It is regulated by the Financial Services Commission (FSC) of the Mauritius and the Cyprus Securities and Exchange Commission (CySEC).

HotForex offers a range of financial instruments for trading, including forex, commodities, indices, and stocks. The broker provides traders with access to deep liquidity through its ECN network, and traders can take advantage of low spreads and fast execution speeds.

One of the key features of HotForex is its range of trading platforms, which includes the popular MetaTrader 4 platform and the HotForex web trader. The broker also offers mobile trading apps for Android and iOS devices. This provides traders with flexibility and convenience, as they can trade from anywhere and at any time.

HotForex also offers a range of educational resources, including market analysis, market news, and educational materials. The broker provides traders with a range of tools and features to help them make informed trading decisions, including technical indicators, charting tools, and a range of trading tools.

In terms of customer support, HotForex offers 24/7 support via phone, email, and live chat. The broker’s customer support team is knowledgeable and responsive, and traders can get help with any questions or issues they may have.

HotForex is a reliable and well-regarded ECN broker that offers a range of trading instruments, low spreads, fast execution speeds, and deep liquidity. The broker is regulated by the FSC of Mauritius and CySEC, and provides traders with a range of trading platforms, educational resources, and customer support. These factors make HotForex a top choice for Forex and CFD traders in Kenya.

Factors to Consider When Choosing ECN Forex Brokers in Kenya?

When choosing an ECN Forex brokers in Kenya, it is important to consider the following factors:

  1. Regulation: It is important to choose an ECN broker that is regulated by a reputable financial regulatory body. This will ensure that your funds are protected and that the broker operates in a transparent and fair manner. Some of the top regulatory bodies in the forex industry include the Financial Conduct Authority (FCA) in the UK, the Australian Securities and Investments Commission (ASIC), and the Financial Services Commission (FSC) of Mauritius.
  2. Trading conditions: ECN forex brokers in Kenya typically offer low spreads, fast execution speeds, and deep liquidity, so it is important to choose a broker that offers competitive trading conditions. This will ensure that you can trade with low costs and execute trades quickly and efficiently.
  3. Trading platforms: The ECN broker should offer a range of trading platforms, including popular options such as MetaTrader 4 and cTrader. The platform should be user-friendly and offer a range of tools and features to help you make informed trading decisions.
  4. Customer support: The ECN broker should offer comprehensive customer support, including 24/7 support via phone, email, and live chat. This will ensure that you can get help when you need it, and that you can resolve any issues quickly and efficiently.
  5. Deposits and withdrawals: The ECN broker should offer a range of deposit and withdrawal options, including credit cards, bank transfers, and e-wallets. It is important to choose a broker that offers fast and secure deposit and withdrawal methods, and that does not charge high fees for transactions.
  6. Research and education: The ECN broker should offer a range of research and education resources, including market analysis, market news, and educational materials. This will help you to stay informed about the markets and make informed trading decisions.
  7. Reputation: Finally, it is important to choose an ECN broker with a strong reputation in the market. This can be determined by reading reviews and testimonials from other traders, and by checking the broker’s regulatory history and track record.

By considering these factors, you can choose an ECN Forex broker that meets your needs and provides you with the best trading conditions and support.

Conclusion

Kenya has a growing forex market, and there are several top ECN Forex brokers operating in the country. These brokers offer traders a range of financial instruments for trading, including forex, commodities, indices, and stocks. They provide access to deep liquidity through their ECN networks and offer low spreads and fast execution speeds.

Some of the top ECN Forex brokers in Kenya include FXTM, OctaFX, IC Markets, XM Group, and HotForex. Each of these brokers has its own unique features, but they all offer a range of trading platforms, educational resources, and customer support.

When choosing  ECN Forex brokers in Kenya, it is important to consider factors such as regulation, trading conditions, trading platforms, customer support, deposits and withdrawals, research and education, and reputation. By carefully considering these factors, traders can choose a broker that meets their needs and provides the best trading conditions and support.

In conclusion, ECN Forex brokers in Kenya play an important role in the growing forex market, and traders have a range of options to choose from. By carefully considering the factors mentioned above, traders can make an informed decision and choose a broker that is reliable and provides the best trading conditions and support.


Maximizing Your Profits with FBS Bonus in Forex Trading: A Complete Guide for 2023

Introduction

FBS Bonus
FBS Bonus

FBS Bonus is a type of promotion offered by FBS, a leading Forex broker, to its clients. The bonus is designed to reward traders for their trading activities and encourage them to continue trading with FBS. The bonus can be used to trade in the Forex market and can result in increased profits for the trader.

There are several types of FBS bonuses available, including welcome bonuses, deposit bonuses, and cashback bonuses. Each bonus has its own set of eligibility requirements and conditions, and traders must meet these requirements in order to claim the bonus.

FBS Bonus can be a valuable tool for Forex traders, as it can increase their trading capital and provide them with additional funds to trade with. However, it is important for traders to understand the risks associated with Forex trading and to have a solid risk management plan in place to protect their capital.

FBS Bonus is a promotion offered by FBS to its clients to reward them for their trading activities and encourage them to continue trading with the broker. The bonus can result in increased profits for traders, but it is important for traders to understand the risks associated with Forex trading and to have a solid risk management plan in place.

Types of FBS Bonuses

FBS Bonus
FBS Bonus

Welcome Bonus

The welcome bonus is a type of  FBS bonus offered by FBS to new traders who open an account with the broker. This bonus provides traders with a set amount of trading capital that they can use to trade in the Forex market.

The welcome bonus is designed to help new traders get started in the Forex market and provide them with additional funds to trade with. This bonus can be a valuable tool for new traders, as it can increase their trading capital and provide them with the opportunity to make profits in the Forex market.

To claim the welcome bonus, new traders must meet the eligibility requirements set by FBS, which may include opening a new trading account and making a minimum deposit. Once the requirements have been met, the bonus will be credited to the trader’s account, and they can start trading with the bonus funds.

It is important for traders to understand the terms and conditions of the welcome bonus, as there may be restrictions on how the bonus can be used and when it can be withdrawn. Additionally, traders should have a solid understanding of Forex trading and a solid risk management plan in place to protect their capital.

Welcome bonus is a type of bonus offered by FBS to new traders who open an account with the broker. This bonus provides traders with additional funds to trade with and can be a valuable tool for new traders. However, it is important for traders to understand the terms and conditions of the bonus and to have a solid risk management plan in place

Deposit Bonus

The deposit bonus is a type of FBS bonus offered to traders who make a deposit into their trading account. This bonus is usually a percentage of the deposit amount and can be used to trade in the Forex market.

The deposit bonus is designed to reward traders for their trading activities and encourage them to continue trading with FBS. This bonus can increase a trader’s trading capital, providing them with additional funds to trade with and increasing their chances of making profits in the Forex market.

To claim the deposit bonus, traders must meet the eligibility requirements set by FBS, which may include making a minimum deposit into their trading account. Once the requirements have been met, the bonus will be credited to the trader’s account, and they can start trading with the bonus funds.

It is important for traders to understand the terms and conditions of the deposit bonus, as there may be restrictions on how the bonus can be used and when it can be withdrawn. Additionally, traders should have a solid understanding of Forex trading and a solid risk management plan in place to protect their capital.

Deposit bonus is a type of bonus offered by FBS to traders who make a deposit into their trading account. This bonus provides traders with additional funds to trade with and can increase their chances of making profits in the Forex market. However, it is important for traders to understand the terms and conditions of the bonus and to have a solid risk management plan in place.

Cashback Bonus

The cashback bonus is a type of bonus offered by FBS to traders that provides them with a cashback on their trading losses. This bonus is designed to help traders recover some of their losses and encourage them to continue trading with FBS.

The cashback bonus is calculated as a percentage of the trader’s trading losses and is credited to their trading account. This bonus can be used to trade in the Forex market and can help traders recover some of their losses, reducing the impact of their losses on their trading capital.

To claim the cashback bonus, traders must meet the eligibility requirements set by FBS, which may include trading a certain number of lots or making a minimum deposit into their trading account. Once the requirements have been met, the cashback bonus will be credited to the trader’s account, and they can start trading with the bonus funds.

It is important for traders to understand the terms and conditions of the cashback bonus, as there may be restrictions on how the bonus can be used and when it can be withdrawn. Additionally, traders should have a solid understanding of Forex trading and a solid risk management plan in place to protect their capital.

Cashback bonus is a type of bonus offered by FBS to traders that provides them with a cashback on their trading losses. This bonus can help traders recover some of their losses and reduce the impact of their losses on their trading capital. However, it is important for traders to understand the terms and conditions of the bonus and to have a solid risk management plan in place.

FBS Bonus
FBS Bonus

Eligibility Requirements For FBS Bonus

The eligibility requirements for FBS bonus vary depending on the type of bonus being offered. Some common eligibility requirements include:

  1. Opening a new trading account with FBS: To claim a welcome bonus, traders must first open a new trading account with FBS.
  2. Making a minimum deposit: Some bonuses, such as deposit bonuses, require traders to make a minimum deposit into their trading account to be eligible for the bonus.
  3. Trading a certain number of lots: Some bonuses, such as cashback bonuses, may require traders to trade a certain number of lots in order to be eligible for the bonus.
  4. Meeting minimum balance requirements: Some bonuses may require traders to maintain a minimum balance in their trading account to be eligible for the bonus.

It is important for traders to carefully review the terms and conditions of each bonus to determine the eligibility requirements and conditions. FBS may change the eligibility requirements and conditions of its bonuses at any time, so it is important for traders to stay informed and updated on the latest requirements.

Eligibility requirements for FBS bonus vary depending on the type of bonus being offered. Traders must carefully review the terms and conditions of each bonus to determine the eligibility requirements and conditions, and stay informed and updated on any changes to the requirements.

How to Claim FBS Bonus

To claim an FBS bonus, traders must follow these steps:

  1. Open a trading account: To claim a welcome bonus, traders must first open a new trading account with FBS.
  2. Meet the eligibility requirements: Traders must meet the eligibility requirements set by FBS for the specific bonus they are claiming.
  3. Make a deposit: If the bonus requires a minimum deposit, traders must make the deposit into their trading account.
  4. Activate the bonus: Once the eligibility requirements have been met, traders can activate the bonus by contacting FBS customer support or by logging into their trading account and selecting the bonus.
  5. Start trading: Once the bonus has been activated, traders can start trading with the bonus funds.

It is important for traders to carefully review the terms and conditions of the bonus to understand any restrictions on how the bonus can be used and when it can be withdrawn. Additionally, traders should have a solid understanding of Forex trading and a solid risk management plan in place to protect their capital.

To claim an FBS bonus, traders must first open a trading account with FBS, meet the eligibility requirements, make a deposit if required, activate the bonus, and start trading. Traders should carefully review the terms and conditions of the bonus to understand any restrictions and have a solid risk management plan in place.

Understanding Risk Management

Risk management is an essential aspect of Forex trading, and it becomes even more important when trading with FBS bonus. FBS offers several types of bonuses, including welcome bonuses, deposit bonuses, and cashback bonuses, and traders must understand risk management to protect their capital and maximize their chances of success.

Risk management involves taking steps to minimize the risks associated with Forex trading. This includes setting stop-loss orders, determining the risk-reward ratio, implementing a successful trading strategy, and taking advantage of market conditions.

Here are some steps to help traders understand and implement effective risk management when trading with FBS bonus:

  1. Set Stop-Loss Orders: A stop-loss order is a type of order that is placed to limit the potential loss on a trade. By setting a stop-loss order, traders can ensure that their losses are limited to a predetermined amount.
  2. Determine the Risk-Reward Ratio: The risk-reward ratio is the ratio of the potential loss on a trade to the potential profit. Traders should determine their risk-reward ratio before entering a trade, as this will help them manage their risk and increase their chances of success.
  3. Implement a Successful Trading Strategy: A successful trading strategy can help traders minimize their risks and increase their chances of making profits. Traders should develop and implement a solid trading strategy that is based on their personal trading style and market conditions.
  4. Take Advantage of Market Conditions: Traders should take advantage of market conditions by trading in the direction of the trend and avoiding trades that are against the trend.

In conclusion, risk management is an essential aspect of Forex trading, and it becomes even more important when trading with FBS bonus. By setting stop-loss orders, determining the risk-reward ratio, implementing a successful trading strategy, and taking advantage of market conditions, traders can protect their capital and increase their chances of success when trading with FBS bonuses.

Implementing a Successful Trading Strategy

Implementing a successful trading strategy is an essential part of Forex trading, as it can help traders minimize their risks and increase their chances of making profits. A successful trading strategy should be based on the trader’s personal trading style and market conditions.

Here are some steps to help traders implement a successful trading strategy:

  1. Determine your trading goals: Before developing a trading strategy, traders should determine their trading goals, such as their desired return on investment and the amount of risk they are willing to take.
  2. Choose a trading style: Traders should choose a trading style that suits their personality and trading goals. Some common trading styles include day trading, swing trading, and position trading.
  3. Conduct market analysis: Traders should conduct market analysis to identify trends and key support and resistance levels. This analysis can be done using technical analysis tools such as chart patterns and indicators.
  4. Develop a trading plan: Based on the market analysis, traders should develop a trading plan that includes entry and exit points, stop-loss orders, and risk management techniques.
  5. Test and refine the strategy: Traders should test their trading strategy on a demo account before implementing it in the live market. They should also refine their strategy as needed based on their trading results.

Implementing a successful trading strategy is an essential part of Forex trading, as it can help traders minimize their risks and increase their chances of making profits. Traders should determine their trading goals, choose a trading style, conduct market analysis, develop a trading plan, and test and refine their strategy as needed.

Taking Advantage of Market Conditions

Taking advantage of market conditions is a crucial aspect of Forex trading, and it becomes even more important when trading with FBS bonus. FBS offers several types of bonuses, including welcome bonuses, deposit bonuses, and cashback bonuses, and traders must understand market conditions to maximize their chances of success when trading with these bonuses.

The Forex market is constantly changing, and market conditions can have a significant impact on the success of a trade. By taking advantage of market conditions, traders can increase their chances of making profits and minimize their risks.

Here are some ways to take advantage of market conditions when trading with FBS bonus:

  1. Trading in the direction of the trend: Traders should trade in the direction of the trend, as this will increase their chances of success. They can identify the trend by conducting market analysis and using technical analysis tools such as trend lines and moving averages.
  2. Avoiding trades against the trend: Traders should avoid trades that are against the trend, as these trades are more likely to result in losses.
  3. Taking advantage of key support and resistance levels: Traders should take advantage of key support and resistance levels, as these levels can provide opportunities for entry and exit points.
  4. Monitoring economic and political events: Traders should monitor economic and political events, as these events can have a significant impact on the Forex market. For example, interest rate changes and political elections can cause significant volatility in the market.

Taking advantage of market conditions is crucial for traders who are trading with FBS bonuses. By trading in the direction of the trend, avoiding trades against the trend, taking advantage of key support and resistance levels, and monitoring economic and political events, traders can increase their chances of success and minimize their risks when trading with FBS bonuses.

Conclusion

FBS is a Forex broker that offers several types of bonuses to its clients, including welcome bonuses, deposit bonuses, and cashback bonuses. Each FBS bonus has its own set of eligibility requirements and conditions, and traders must carefully review the terms and conditions of each bonus before claiming it.

In order to be successful in Forex trading, traders must have a solid understanding of price action trading strategies, risk management, and market conditions. They should also implement a successful trading strategy, determine their trading goals, and take advantage of market conditions.

In order to claim an FBS bonus, traders must first open a trading account with FBS, meet the eligibility requirements, make a deposit if required, activate the bonus, and start trading. Traders should carefully review the terms and conditions of the bonus to understand any restrictions and have a solid risk management plan in place.

FBS is a Forex broker that offers several types of bonuses to its clients, and traders must have a solid understanding of price action trading strategies, risk management, and market conditions to be successful in Forex trading.


Mastering the Art of Forex Trading Price Action Strategy: A Comprehensive Guide to Implementing a Successful Price Action Strategy for 2023

Introduction

Price action strategy is a popular and effective trading strategy that has been used by many traders to make profitable trades in the financial market. It is a method of analyzing and making trading decisions based on the price movements of an asset, rather than relying on technical indicators or fundamental analysis.

What is Price Action Strategy?

Price action Strategy is a trading method of analyzing and making trading decisions based on the price movements of an asset, without relying on technical indicators or fundamental analysis. It involves observing the price patterns of an asset and making trades based on the current market conditions. Price action traders believe that the price movement of an asset is the best indicator of market sentiment and future price movements, and therefore, focus on studying the price charts of the asset they are trading.

Price Action Strategy

Why Price Action Trading is Popular?

Price action strategy trading is a popular trading technique because it is simple, straightforward, and does not require the use of complex indicators or tools. It is based on the idea that the market is made up of buying and selling pressure and that price is a reflection of this pressure. Price action traders rely on the price chart to determine the market trend and make trades based on the current market conditions.

Benefits of Price Action Strategy Trading There are several benefits of using price action trading, including:

  • Simplicity: Price action strategy trading is a simple and straightforward trading strategy that does not require the use of complex indicators or tools.
  • Flexibility: Price action strategy trading can be applied to any financial market, including stocks, forex, commodities, and cryptocurrencies.
  • No Indicator Lag: Unlike technical indicators, price action traders do not experience lag when making trades as they are basing their trades on the current market conditions.
  • Better Risk Management: Price action traders can use the price chart to determine their risk-reward ratio and make trades accordingly.
  • Emotionless Trading: Price action traders do not make trades based on emotions but rather on the current market conditions, which can lead to more consistent profits.

 Understanding Price Action Trading Patterns

Price action traders rely on price chart patterns to make trading decisions.

Some of the most common price action patterns include:

  • Trends: Trends are one of the most important patterns in Price action strategy  trading. Trends can be either up, down, or sideways. Price action traders look for trends to determine the market direction and make trades accordingly.
  • Support and Resistance: Support and resistance levels are key levels on the price chart where the price of an asset has a difficult time breaking through. Price action traders use support and resistance levels to determine the market sentiment and make trades accordingly.
  • Candlestick Patterns: Candlestick patterns are a popular price action pattern used by traders to make trading decisions. Some of the most common candlestick patterns include the doji, hammer, and shooting star.

Importance of Trading Psychology in Price Action Strategy

Trading psychology is an important aspect of price action Strategy  as it can have a significant impact on a trader’s success. Price action traders need to be able to control their emotions and make trades based on the current market conditions, rather than their emotions. Some tips for developing a strong trading psychology include:

  • Developing a Trading Plan: Price action traders need to have a clear and well-defined trading plan that outlines their trading strategies, risk management strategies, and goals.
  • Sticking to the Plan: Price action traders need to stick to their trading plan and not make trades based on emotions.
  • Managing Risk: Price action traders need to manage their riskeffectively by setting stop-loss orders and determining their risk-reward ratio before entering a trade.
    • Taking Breaks: Price action traders need to take breaks from trading to avoid burnout and maintain a clear and focused mind.
    • Staying Disciplined: Price action traders need to stay disciplined and stick to their trading plan, even during losing trades.

       How to Implement a Successful Price Action Trading Strategy?

      Implementing a successful price action  strategy trading  requires discipline, patience, and a thorough understanding of the market. Price action strategy trading is a technique that focuses on analyzing the price movements of an asset rather than relying on indicators or other technical tools. To be successful with this strategy, traders need to follow the steps outlined below.

      1. Study the Price Chart: The first step in implementing a successful price action trading strategy is to study the price chart of the asset you are trading. Look for trends in the market and identify key support and resistance levels. This information will help you make informed trades based on the current market conditions.
      2. Determine Market Trend: Once you have studied the price chart, you need to determine the market trend. Is the market in an uptrend, downtrend, or sideways trend? This information will help you make trades in the direction of the trend, increasing your chances of success.
      3. Identify Key Support and Resistance Levels: Key support and resistance levels are important levels on the price chart where the price has had difficulty breaking through. Identifying these levels will help you determine the market sentiment and make trades accordingly.
      4. Determine Risk-Reward Ratio: Before entering a trade, it is important to determine your risk-reward ratio. This involves setting a stop-loss order and determining the potential profit of the trade. This will help you manage your risk and increase your chances of success.
      5. Make Trades Based on Current Market Conditions: When making trades, it is important to base your decisions on the current market conditions rather than your emotions. This will help you stay disciplined and stick to your trading plan, increasing your chances of success.
      6. Take Breaks: Price action strategy trading can be mentally and emotionally demanding, so it is important to take breaks from trading to avoid burnout and maintain a clear and focused mind.
      7. Stay Disciplined: Staying disciplined is key to success in price action strategy trading. Stick to your trading plan, even during losing trades, and avoid letting your emotions influence your decisions.

      Implementing a successful price action strategy trading requires discipline, patience, and a thorough understanding of the market. By studying the price chart, determining the market trend, identifying key support and resistance levels, determining your risk-reward ratio, making trades based on current market conditions, taking breaks, and staying disciplined, traders can increase their chances of success in price action trading.

Price Action Strategy

Types of Forex Trading Price Action Strategy

  1. Trend Following
  2. Breakout Trading
  3. Pin Bar Trading
  4. Inside Bar Trading
  5. Price Action Confluence

Trend Following Trading  Price Action  Strategy

Trend following is a popular price action trading strategy that involves identifying the market trend and making trades in the direction of the trend. This strategy is based on the idea that the market tends to trend and that traders can make profitable trades by following the trend.

To implement a trend following strategy, traders need to first identify the market trend. This can be done by looking at the price chart and determining if the market is in an uptrend, downtrend, or sideways trend. Once the trend has been identified, traders can then make trades in the direction of the trend.

One of the key benefits of trend following is that it is a simple and straightforward strategy that does not require the use of complex indicators or tools. It is also a flexible strategy that can be applied to any financial market, including Forex, stocks, commodities, and cryptocurrencies.

However, it is important for traders to be aware of the potential drawbacks of trend following. The market can be unpredictable and can change direction quickly, so it is important for traders to have a solid risk management plan in place to protect their capital. Additionally, traders need to be able to identify the market trend accurately to be successful with this strategy.

Trend following is a popular price action trading strategy that can be used to make profitable trades in the Forex market. By identifying the market trend and making trades in the direction of the trend, traders can achieve consistent profits. However, it is important for traders to have a solid risk management plan in place and to be able to identify the market trend accurately to be successful with this strategy.

Breakout Trading Price Action Strategy

Breakout trading is a price action strategy that involves identifying key support and resistance levels and making trades when the price breaks through these levels. This strategy is based on the idea that the market tends to move in a range and that traders can make profitable trades by identifying when the market is breaking out of its range.

To implement a breakout trading strategy, traders need to first identify key support and resistance levels on the price chart. This can be done by looking at previous price swings and determining the levels where the price has had difficulty breaking through. Once these levels have been identified, traders can then look for price breakouts to occur and make trades based on the direction of the breakout.

One of the key benefits of breakout trading is that it allows traders to take advantage of significant price movements in the market. When the price breaks through a key support or resistance level, it can often result in a significant price movement, providing traders with the opportunity to make profits.

However, it is important for traders to be aware of the potential drawbacks of breakout trading. False breakouts can occur, where the price appears to break through a key level but then quickly reverses, resulting in losses for traders. Additionally, traders need to have a solid risk management plan in place to protect their capital.

Breakout trading is a price action trading strategy that can be used to make profitable trades in the Forex market. By identifying key support and resistance levels and making trades based on price breakouts, traders can take advantage of significant price movements in the market. However, it is important for traders to be aware of false breakouts and to have a solid risk management plan in place.

Pin Bar  Trading  Price Action Strategy

Pin bar trading is a price action  strategy that involves identifying pin bar candlestick patterns on the price chart and making trades based on the reversal signal provided by these patterns.

A pin bar is a candlestick pattern that has a long wick and a small body. The long wick represents the rejection of a certain price level, while the small body represents indecision in the market. When a pin bar forms, it signals a potential reversal in the market, providing traders with the opportunity to make trades in the direction of the reversal.

To implement a pin bar trading strategy, traders need to first identify pin bar candlestick patterns on the price chart. This can be done by looking for patterns with a long wick and a small body, and making sure that the wick is at least twice as long as the body. Once a pin bar has been identified, traders can then make trades based on the reversal signal provided by the pattern.

One of the key benefits of pin bar trading is that it allows traders to make trades based on a clear and defined reversal signal. Pin bar patterns are reliable indicators of potential market reversals, providing traders with a high degree of confidence when making trades.

However, it is important for traders to be aware of the potential drawbacks of pin bar trading. False pin bar patterns can occur, where the price does not actually reverse in the direction indicated by the pattern. Additionally, traders need to have a solid risk management plan in place to protect their capital.

Pin bar trading is a price action strategy that can be used to make profitable trades in the Forex market. By identifying pin bar candlestick patterns on the price chart and making trades based on the reversal signal provided by these patterns, traders can take advantage of potential market reversals. However, it is important for traders to be aware of false pin bar patterns and to have a solid risk management plan in place.

Price Action Strategy

Inside Bar Trading  Price Action Strategy

Inside bar trading is a price action  strategy that involves identifying inside bar candlestick patterns on the price chart and making trades based on the reversal signal provided by these patterns.

An inside bar is a candlestick pattern that is contained within the range of the preceding bar. The inside bar signals indecision in the market, with neither the buyers nor the sellers being able to gain control. When an inside bar forms, it signals a potential reversal in the market, providing traders with the opportunity to make trades in the direction of the reversal.

To implement an inside bar trading strategy, traders need to first identify inside bar candlestick patterns on the price chart. This can be done by looking for patterns where the current bar is contained within the range of the preceding bar. Once an inside bar has been identified, traders can then make trades based on the reversal signal provided by the pattern.

One of the key benefits of inside bar trading is that it allows traders to make trades based on a clear and defined reversal signal. Inside bar patterns are reliable indicators of potential market reversals, providing traders with a high degree of confidence when making trades.

However, it is important for traders to be aware of the potential drawbacks of inside bar trading. False inside bar patterns can occur, where the price does not actually reverse in the direction indicated by the pattern. Additionally, traders need to have a solid risk management plan in place to protect their capital.

Inside bar trading is a  trading price action  strategy that can be used to make profitable trades in the Forex market. By identifying inside bar candlestick patterns on the price chart and making trades based on the reversal signal provided by these patterns, traders can take advantage of potential market reversals. However, it is important for traders to be aware of false inside bar patterns and to have a solid risk management plan in place.

Price Action Confluence Price Action Strategy Trading

Price action confluence is a price action trading strategy that involves identifying multiple price action signals at key levels of support and resistance and making trades based on the confluence of these signals.

Confluence is the idea of having multiple factors aligning to support a trade. In price action trading, confluence occurs when multiple price action signals are present at key levels of support and resistance. When multiple signals align, it increases the probability of a successful trade, making it a more attractive opportunity for traders.

To implement a price action confluence strategy, traders need to first identify key levels of support and resistance on the price chart. They can then look for multiple price action signals, such as pin bar patterns or inside bar patterns, to occur at these key levels. Once multiple signals are present, traders can then make trades based on the confluence of these signals.

One of the key benefits of price action confluence is that it allows traders to make trades based on a higher probability of success. When multiple signals are present at key levels of support and resistance, it increases the likelihood of a successful trade, providing traders with a higher degree of confidence when making trades.

However, it is important for traders to be aware of the potential drawbacks of price action confluence. False signals can occur, where the multiple signals do not actually result in a successful trade. Additionally, traders need to have a solid risk management plan in place to protect their capital.

In conclusion, price action confluence is a trading price action strategy that can be used to make profitable trades in the Forex market. By identifying multiple price action signals at key levels of support and resistance and making trades based on the confluence of these signals, traders can take advantage of higher probability trades. However, it is important for traders to be aware of false signals and to have a solid risk management plan in place.


Understanding Volume Indicators for Better Trading: On-Balance Volume, Volume Oscillator, Money Flow Index, and More in 2023

volume indicators

Introduction

Trading in the financial market requires a good understanding of the market trends and patterns. One important factor to consider when analyzing the market is the trading volume. The volume is the number of shares traded over a specific period, which can indicate the strength of a trend or the level of market participation.

Volume indicators are powerful tools that can help traders to identify trends, confirm price movements, and make informed trading decisions. In this article, we will explore some of the most popular volume indicators, including On-Balance Volume, Volume Oscillator, Money Flow Index, and more, and how they can help traders predict market movements.

On-Balance Volume (OBV)

On-Balance Volume (OBV) is a technical analysis indicator that measures buying and selling pressure by adding or subtracting the volume on up days and down days, respectively. The theory behind the OBV is that when the volume increases, the price tends to move in the same direction, indicating a strong trend. Conversely, when the volume decreases, the price tends to move in the opposite direction, indicating a weak trend.

The OBV indicator is calculated by adding the volume to a cumulative total when the closing price increases and subtracting the volume when the closing price decreases. The cumulative total represents the overall buying and selling pressure in the market. Traders can use the OBV indicator to confirm price movements and identify divergences between the price and the volume. A bullish divergence occurs when the price is making a lower low, while the OBV is making a higher low, indicating that the buying pressure is increasing. A bearish divergence occurs when the price is making a higher high, while the OBV is making a lower high, indicating that the selling pressu

volume indicators
volume indicators

re is increasing.

Volume Oscillator

The Volume Oscillator is a technical analysis indicator that measures the difference between two moving averages of the volume. The moving averages are usually calculated over a short-term and a long-term period, such as 14 days and 28 days, respectively. The Volume Oscillator is plotted as a histogram that fluctuates around a zero line. When the histogram is above the zero line, the short-term volume is higher than the long-term volume, indicating a bullish trend. Conversely, when the histogram is below the zero line, the short-term volume is lower than the long-term volume, indicating a bearish trend.

Traders can use the Volume Oscillator to identify trends and overbought or oversold conditions. A bullish signal occurs when the histogram crosses above the zero line, indicating that the short-term volume is increasing relative to the long-term volume. A bearish signal occurs when the histogram crosses below the zero line, indicating that the short-term volume is decreasing relative to the long-term volume.

Money Flow Index (MFI)

The Money Flow Index (MFI) is a technical analysis indicator that measures the buying and selling pressure based on both price and volume. The MFI indicator is calculated by dividing the sum of positive money flow by the sum of negative money flow and then multiplying the result by 100. The positive money flow is the money flow that occurs on days when the price closes higher than the previous day, while the negative money flow is the money flow that occurs on days when the price closes lower than the previous day.

The MFI indicator oscillates between 0 and 100, with a reading above 80 indicating an overbought condition and a reading below 20 indicating an oversold condition. Traders can use the MFI indicator to confirm price movements and identify divergences between the price and the volume. A bullish divergence occurs when the price is making a lower low, while the MFI is making a higher low, indicating

hat the buying pressure is increasing. A bearish divergence occurs when the price is making a higher high, while the MFI is making a lower high, indicating that the selling pressure is increasing.

Traders can also use the MFI indicator to identify trend reversals. A bullish reversal occurs when the MFI crosses above the oversold level of 20 and then crosses above the 50 level, indicating a potential trend reversal. A bearish reversal occurs when the MFI crosses below the overbought level of 80 and then crosses below the 50 level, indicating a potential trend reversal.

Chaikin Money Flow (CMF)

Chaikin Money Flow (CMF) is a technical analysis indicator that measures the buying and selling pressure based on both price and volume. The CMF indicator is calculated by multiplying the volume by the price change and then dividing the result by the total volume. The result represents the amount of money that flows in or out of the market.

The CMF indicator oscillates between -1 and +1, with a reading above 0 indicating a buying pressure and a reading below 0 indicating a selling pressure. Traders can use the CMF indicator to confirm price movements and identify trend reversals. A bullish signal occurs when the CMF crosses above the zero line, indicating a buying pressure. A bearish signal occurs when the CMF crosses below the zero line, indicating a selling pressure.

How to Use Volume Indicators in Trading

Volume indicators can be used in different ways, depending on the trading style and the market conditions. Here are some general tips on how to use volume indicators in trading:

  1. Confirm price movements: Volume indicators can help traders to confirm the direction and strength of the trend. When the price is moving in one direction and the volume is increasing, it confirms the trend. Conversely, when the price is moving in one direction and the volume is decreasing, it indicates a weak trend.
  2. Identify trend reversals: Volume indicators can help traders to identify potential trend reversals. When the volume is increasing, and the price is moving in the opposite direction, it indicates a potential trend reversal.
  3. Spot overbought or oversold conditions: Volume indicators can help traders to identify overbought or oversold conditions. When the volume is high, and the price is reaching a resistance level, it indicates an overbought condition. When the volume is low, and the price is reaching a support level, it indicates an oversold condition.
  4. Use in combination with other indicators: Volume indicators can be used in combination with other technical analysis indicators to improve the accuracy of the trading signals. For example, traders can use the Moving Average Convergence Divergence (MACD) indicator with the OBV indicator to confirm the direction of the trend and the strength of the momentum.

Application of Volume indicator in the Real World

To further understand the importance of volume indicators, it is crucial to consider their application in the real world. One example is how volume indicators were useful in predicting the market crash of 2008. Prior to the crash, many traders noticed a divergence between the S&P 500 and the volume indicator. The S&P 500 was making higher highs, but the volume was decreasing, indicating that the market was reaching an unsustainable level. This divergence was a strong warning signal that the market was overbought and a correction was imminent.

Another example of how volume indicators can be used in trading is in the cryptocurrency market. Cryptocurrencies are notorious for their volatility, and volume indicators can help traders to identify trends and overbought or oversold conditions. In the cryptocurrency market, traders can use the Money Flow Index (MFI) indicator to confirm price movements and identify divergences between the price and the volume. By using the MFI indicator, traders can avoid entering trades based on false breakouts and limit their losses.

What are the Risks Associated with the volume Oscillator o indicator?

When it comes to using volume indicators, it is important to keep in mind that they are not infallible. No trading indicator can provide a guaranteed prediction of market trends, and volume indicators are no exception. It is crucial for traders to use volume indicators in combination with other technical analysis tools, such as moving averages, trend lines, and oscillators, to improve the accuracy of their trading signals.

Furthermore, traders should also consider the context and time frame in which they are using volume indicators. Different markets have different characteristics, and what works for one market may not work for another. In addition, volume indicators can produce different signals depending on the time frame used, so traders should experiment with different time frames and find what works best for their trading style.

Lastly, it is important for traders to practice proper risk management when using volume indicators or any other trading tool. No matter how accurate a trading signal may seem, there is always a risk involved, and traders should only risk what they can afford to lose. Proper risk management includes setting stop loss levels, determining the appropriate position size, and diversifying the portfolio.

 What are other technical analysis that a trader can combine in trading to be successful ?

To achieve success in trading, it is important to use a variety of technical analysis tools in combination with volume indicators. Here are a few examples:

  1. Moving Averages: Moving averages are one of the most popular technical analysis tools, and they can be used in combination with volume indicators to confirm the direction of the trend. Traders can use the Moving Average Convergence Divergence (MACD) indicator with the OBV indicator, for instance, to confirm the direction of the trend and the strength of the momentum.
  2. Oscillators: Oscillators are technical analysis tools that help traders to identify overbought or oversold conditions in the market. Examples of oscillators include the Relative Strength Index (RSI) and the Stochastic Oscillator. Traders can use these oscillators in combination with volume indicators to confirm price movements and identify potential trend reversals.
  3. Chart Patterns: Chart patterns are graphical representations of price movements that can help traders to identify potential trend reversals or continuations. Examples of chart patterns include head and shoulders, double tops and bottoms, and triangles. Traders can use chart patterns in combination with volume indicators to confirm the validity of the pattern and improve the accuracy of their trading signals.
  4. Fundamental Analysis: Fundamental analysis is the study of economic and financial data to understand the underlying value of an asset. Fundamental analysis can be used in combination with technical analysis, including volume indicators, to make informed trading decisions. By combining both types of analysis, traders can gain a deeper understanding of the market and make more informed trading decisions.

In conclusion, achieving success in trading requires a combination of technical analysis tools and a deep understanding of the market. Volume indicators can be a powerful tool to help traders identify trends and make informed trading decisions. However, traders should also use other technical analysis tools, such as moving averages and oscillators, and consider fundamental analysis to make well-informed trading decisions. By using a combination of these tools, traders can improve the accuracy of their trading signals and achieve greater success in their trading careers.

volume indicators
volume indicators

Trading Platforms and Software Packages that offer Volume Indicators to Traders.

There are many different trading platforms and software packages that offer volume indicators to traders. Some popular platforms and software packages include:

  1. MetaTrader: MetaTrader is a widely used trading platform that offers a variety of technical analysis tools, including volume indicators such as On-Balance Volume (OBV), Volume Oscillator, and Money Flow Index (MFI). MetaTrader is compatible with a wide range of brokers and offers customizable charts and graphs.

How to install Volume Indicators in MT4 and MT5

In MetaTrader, traders can install custom indicators, including volume indicators, in just a few steps.

Here are the steps to install a volume indicator in MetaTrader:

  1. Download the indicator file: Traders can find volume indicators online and download them as a file. The indicator file typically has a .ex4 or .mq4 extension.
  2. Open the MetaTrader platform: After downloading the indicator file, open the MetaTrader platform.
  3. Open the Navigator window: In the MetaTrader platform, go to the Navigator window, which is usually located on the left-hand side of the screen.
  4. Click on “Indicators”: In the Navigator window, click on “Indicators” to expand the list of indicators.
  5. Click on “Custom”: In the Indicators list, click on “Custom” to expand the list of custom indicators.
  6. Drag and drop the indicator file: From the folder where the indicator file was downloaded, drag and drop the file into the Custom folder in the Indicators list.
  7. Refresh the Navigator window: After dragging and dropping the indicator file, right-click on the Navigator window and select “Refresh” to update the list of indicators.
  8. Apply the indicator to the chart: After refreshing the Navigator window, the newly installed volume indicator should appear in the Custom Indicators list. To apply the indicator to a chart, simply drag and drop it onto the chart.


volume indicators
volume indicators

MetaTrader also offers a range of customization options for volume indicators, allowing traders to adjust the settings to best suit their trading strategy. Traders can customize the colors, line styles, and periods for volume indicators to enhance their readability and clarity on the chart.

In conclusion, installing volume indicators in MetaTrader is a straightforward process that can be completed in just a few steps. By utilizing MetaTrader’s customization options for volume indicators, traders can enhance their trading strategy and gain a better understanding of market trends.

  1. TradingView: TradingView is a web-based charting platform that offers a variety of technical analysis tools, including volume indicators such as Chaikin Money Flow (CMF), OBV, and MFI. TradingView offers customizable charts and graphs, and users can save and share their chart layouts with others.
  2. Thinkorswim: Thinkorswim is a trading platform offered by TD Ameritrade that offers a wide range of technical analysis tools, including volume indicators such as On-Balance Volume and Chaikin Money Flow. Thinkorswim is known for its powerful charting capabilities and is popular among advanced traders.
  3. eSignal: eSignal is a trading platform that offers a variety of technical analysis tools, including volume indicators such as Volume Oscillator and Money Flow Index. eSignal is known for its real-time data feeds and its ability to support a wide range of markets, including stocks, futures, and forex.
  4. NinjaTrader: NinjaTrader is a trading platform that offers a variety of technical analysis tools, including volume indicators such as OBV and MFI. NinjaTrader offers customizable charts and graphs, as well as advanced order management and backtesting capabilities.

In conclusion, there are many different trading platforms and software packages that offer volume indicators to traders. It is important for traders to choose a platform that offers the technical analysis tools and features that best suit their trading style and needs. By using a platform that offers reliable and customizable volume indicators, traders can gain a deeper understanding of market trends and make more informed trading decisions.

Conclusion

Volume indicators are a crucial tool for traders looking to make informed decisions in the financial markets. On-Balance Volume, Volume Oscillator, Money Flow Index, and Chaikin Money Flow are among the most popular volume indicators used by traders. Each indicator has its unique strengths and weaknesses, and traders can use them in combination with other technical analysis tools, such as moving averages and oscillators, to improve the accuracy of their trading signals.

When it comes to trading platforms and software packages, MetaTrader, TradingView, Thinkorswim, eSignal, and NinjaTrader are among the most popular platforms that offer volume indicators. Traders can choose the platform that best suits their trading style and needs, based on features like customizable charts and graphs, real-time data feeds, and advanced order management and backtesting capabilities.

In using volume indicators, traders should keep in mind that no indicator is infallible, and that they should be used in combination with other technical analysis tools, taking into account the context and time frame of the market. Traders should also practice proper risk management to avoid significant losses.

By utilizing volume indicators in combination with other technical analysis tools and by taking a thoughtful and disciplined approach to trading, traders can gain a better understanding of market trends and make more informed trading decisions. With time, experience, and a willingness to learn, traders can build successful and profitable trading careers.


Forex Trading and How to Make Money from It

We have researched extensively on Forex trading and how to make money from it, and we have come up with a comprehensive guide that will help you outrank other websites in Google search results. In this guide, we will cover all the essential topics that you need to know about Forex trading to be successful.

Introduction

Forex trading, also known as foreign exchange trading, is the process of buying and selling currencies in the global market. Forex trading is a popular way of investing and making money, and it can be done by anyone with an internet connection and a computer.

How to Get Started with Forex Trading?

To get started with Forex trading, you need to follow these steps:

  1. Learn the Basics of Forex Trading.  Before you start trading, you need to learn the basics of Forex trading, such as what Forex trading is, how it works, the terminologies used in Forex trading, and the various strategies that you can use to make a profit.
  2. Choose a Forex Broker.  To start trading, you need to choose a Forex broker that will allow you to buy and sell currencies. You need to choose a reliable and reputable broker that offers low spreads, excellent customer service, and a user-friendly trading platform.
  3. Open a Forex Trading Account. Once you have chosen a broker, you need to open a Forex trading account. You will need to provide some personal information, such as your name, address, and phone number, and then deposit some money into your account.
  4. Download a Trading Platform. After you have opened your trading account, you need to download a trading platform. A trading platform is software that you use to buy and sell currencies. You need to choose a trading platform that is user-friendly and has all the features that you need.
  5. Start Trading. Once you have downloaded a trading platform, you can start trading. You need to follow the market trends and use your trading strategies to make a profit.

Forex Trading Strategies

There are several Forex trading strategies that you can use to make a profit. Some of these strategies include:

  1. Technical Analysis: Technical analysis is the study of historical price and volume data to identify trends and make predictions about future market movements.
  2. Fundamental Analysis: Fundamental analysis is the study of economic and financial data to identify the underlying factors that affect the value of currencies.
  3. Price Action Trading: Price action trading is the study of price movements to identify patterns and make predictions about future market movements.
  4. Swing Trading: Swing trading is a trading strategy that involves holding positions for a few days to a few weeks to take advantage of short-term market movements.

Risk Management in Forex Trading

Forex trading involves a high level of risk, and it is essential to manage your risk to avoid losing money. Some of the risk management strategies that you can use include:

  1. Stop Loss Orders- A stop-loss order is an order to close a position automatically if the market moves against you.
  2. Take Profit Orders -A take-profit order is an order to close a position automatically if the market moves in your favor.
  3. Position Sizing -Position sizing is the process of determining the size of your position based on the amount of risk that you are willing to take.

Conclusion

Forex trading is a popular way of investing and making money, but it requires knowledge, skills, and discipline. In this guide, we have covered the basics of Forex trading, the steps to get started, the trading strategies, and the risk management strategies. By following the information provided in this guide, you can increase your chances of success in Forex trading.

Unlocking Trading Success with Pivot Points: A Comprehensive Guide 2023

Pivot Points


Pivot Points
Pivot Points

Introduction

Pivot Points are a popular technical analysis tool used by traders to determine potential levels of support and resistance in the market. They are derived from the previous day’s high, low, and close prices and can be used to identify potential trend reversals, breakouts, and key levels of support and resistance.

What are Pivot Points?

Pivot Points are a technical analysis tool used by traders to determine potential levels of support and resistance in the market. They are derived from the previous day’s high, low, and close prices and are calculated as follows:

Pivot Point = (High + Low + Close) / 3

Support and resistance levels are then calculated as follows:

First level of support and resistance: Support 1 (S1) = (2 x Pivot Point) – High Resistance 1 (R1) = (2 x Pivot Point) – Low

Second level of support and resistance: Support 2 (S2) = Pivot Point – (High – Low) Resistance 2 (R2) = Pivot Point + (High – Low)

Third level of support and resistance: Support 3 (S3) = Low – 2 x (High – Pivot Point) Resistance 3 (R3) = High + 2 x (Pivot Point – Low)

How do Pivot Points work?

Pivot Points are a popular technical analysis tool used by traders to determine potential levels of support and resistance in the market. They are derived from the previous day’s high, low, and close prices and can be used to identify potential trend reversals, breakouts, and key levels of support and resistance.

They are calculated as follows:

Pivot Point = (High + Low + Close) / 3

Support and resistance levels are then calculated as follows:

First level of support and resistance: Support 1 (S1) = (2 x Pivot Point) – High Resistance 1 (R1) = (2 x Pivot Point) – Low

Second level of support and resistance: Support 2 (S2) = Pivot Point – (High – Low) Resistance 2 (R2) = Pivot Point + (High – Low)

Third level of support and resistance: Support 3 (S3) = Low – 2 x (High – Pivot Point) Resistance 3 (R3) = High + 2 x (Pivot Point – Low)

The Pivot Point itself represents the middle point of the trading range for the previous day, with the support and resistance levels indicating potential areas of reversal or continuation in the market.

For example, if the price of an asset is approaching the first level of support (S1), it may indicate that the asset is oversold and that a potential reversal may be imminent. Conversely, if the price of the asset is approaching the first level of resistance (R1), it may indicate that the asset is overbought and that a potential reversal may be imminent.

Pivot Points can also be used to identify potential breakouts. For example, if the price of an asset breaks above the first level of resistance (R1), it may indicate that a bullish breakout is imminent. Conversely, if the price of the asset breaks below the first level of support (S1), it may indicate that a bearish breakout is imminent.

Pivot Points can also be used to identify trends. If the price of an asset is trading above the Pivot Point, it may indicate that the asset is in an uptrend, and if the price is trading below the Pivot Point, it may indicate that the asset is in a downtrend

Pivot Points
Pivot Points

How to Use Pivot Points

Pivot Points can be used in a number of ways to make informed trading decisions. Some of the most common ways to use Pivot Points include:

  1. Identifying Support and Resistance Levels

The most common use of Pivot Points is to identify potential levels of support and resistance in the market. Traders can use this information to make informed trading decisions. For example, if the price of an asset is approaching the first level of support (S1), it may be time to buy the asset, and if it is approaching the first level of resistance (R1), it may be time to sell.

  1. Identifying Breakouts

Pivot Points can also be used to identify potential breakouts. For example, if the price of an asset breaks above the first level of resistance (R1), it may indicate that a bullish breakout is imminent. Conversely, if the price of the asset breaks below the first level of support (S1), it may indicate that a bearish breakout is imminent. Traders can use this information to make informed trading decisions.

  1. Overlapping Timeframes

Pivot Points can also be used on overlapping timeframes to identify potential levels of support and resistance. For example, if the Pivot Points on the daily chart and the 4-hour chart are both indicating that the asset is approaching a level of resistance, it may indicate that a reversal is imminent.

  1. Using Other Indicators

Traders can also use other technical indicators in conjunction with these Points to make informed trading decisions. For example, if the price of an asset is approaching the first level of support (S1) and the Relative Strength Index (RSI) is indicating that the asset is oversold, it may indicate that a reversal is imminent.

  1. Multiple Pivot Points

Traders can also use multiple Points to identify potential levels of support and resistance. For example, some traders may use daily, weekly, and monthly Pivot Points to identify potential levels of support and resistance on multiple timeframes.

Limitations of Pivot Points

Pivot points are a popular technical analysis tool used by Forex traders, but there are some limitations to their use that traders should be aware of. Understanding these limitations can help traders make more informed trading decisions and avoid potential pitfalls when using pivot points in their trading strategy.

Here are some of the limitations of pivot points:

  1. Lack of Adaptability: These points are calculated using a fixed formula, which means they do not take into account changes in market conditions or volatility. This can result in pivot points becoming less relevant over time and leading to inaccurate signals.
  2. Limited Price Information: these points are based on a single day’s price data, and do not take into account previous price trends or patterns. This can limit their usefulness as a standalone trading tool, and traders may need to use other technical analysis tools in conjunction with pivot points.
  3. Inconsistent Results: These points are based on a mathematical formula, which means that their results can be inconsistent and unreliable. This can lead to false signals and misinformed trading decisions.
  4. Limited Flexibility: These points are calculated using a fixed formula, and cannot be adjusted to reflect a trader’s personal trading style or market conditions. This can limit their usefulness as a trading tool and lead to ineffective trades.

Pivot points are a popular technical analysis tool used by Forex traders, but there are some limitations to their use. Traders should be aware of these limitations and use pivot points in conjunction with other technical analysis tools and market analysis to make more informed trading decisions.

Conclusion

Pivot Points are a popular technical analysis tool used by traders to determine potential levels of support and resistance in the market. They are derived from the previous day’s high, low, and close prices, and can be used to identify potential trend reversals, breakouts, and key levels of support and resistance.

Traders can use Pivot Points in a number of ways to make informed trading decisions, including identifying support and resistance levels, identifying breakouts, overlapping timeframes, using other indicators, and using multiple Pivot Points.

As with any trading indicator, Pivot Points should be used in conjunction with other technical analysis tools and indicators to make informed trading decisions. Traders should also be aware of the limitations of Pivot Points and should use them in combination with other analysis techniques to maximize their trading success.


Maximizing Trading Profits with the Relative Strength Index (RSI): A Comprehensive Guide 2023

Relative Strength Index

Introduction

The Relative Strength Index (RSI) is one of the most popular technical analysis indicators used by traders to determine overbought and oversold conditions in the market. Developed by J. Welles Wilder Jr. in the late 1970s, the RSI is a momentum oscillator that compares the magnitude of recent gains to recent losses in an attempt to determine whether a particular asset is oversold or overbought.

In this comprehensive guide, we will delve deep into the concept of RSI, how it works, and the various ways it can be used to make informed trading decisions.

What is RSI?

The Relative Strength Index( RSI) is a technical analysis indicator that measures the strength of an asset’s price action, usually on a scale of 0 to 100. It is a momentum oscillator that oscillates between 0 and 100, with values above 70 indicating that an asset is overbought and values below 30 indicating that it is oversold.

The formula for RSI is based on the average gain and loss over a specified time period, typically 14 days. The RSI is calculated as follows:

RSI = 100 – [100/(1 + RS)]

where RS is the average of the n-day up closes divided by the average of the n-day down closes.

How Does RSI Work?

The Relative Strength Index (RSI) is a technical analysis indicator that helps traders to measure the strength of an asset’s price action. It is a momentum oscillator that compares the magnitude of recent gains to recent losses in an attempt to determine whether a particular asset is overbought or oversold.

The RSI is a measure of the asset’s price momentum, typically on a scale of 0 to 100. An RSI value of above 70 is considered overbought, while an RSI value of below 30 is considered oversold.

The RSI is calculated using a mathematical formula that takes into account the asset’s average gain and loss over a specified period, typically 14 days. The RSI formula is:

RSI = 100 – [100/(1 + RS)]

Where RS is the average of the n-day up closes divided by the average of the n-day down closes.

To understand how RSI works, let’s take an example of a stock that is trading at $100 per share. The RSI is calculated over a 14-day period, and over the past 14 days, the stock has closed up for 8 days and down for 6 days. The average gain is therefore 8/14 or 57.14%, while the average loss is 6/14 or 42.86%.

To calculate the RSI, we need to first calculate the Relative Strength (RS). The formula for RS is:

RS = Average Gain / Average Loss

Using the example above, the RS would be:

RS = 57.14 / 42.86 = 1.33

The RSI is then calculated using the RS formula mentioned earlier:

RSI = 100 – [100/(1 + RS)]

RSI = 100 – [100/(1 + 1.33)]

RSI = 45.47

In this case, the RSI for the stock would be 45.47, which is below the 50 level, indicating that the stock is in a downtrend.

The Relative Strength Index (RSI) can be used in a number of ways to make informed trading decisions. One of the most common uses of the RSI is to identify overbought and oversold conditions in the market. When the RSI is above 70, it is considered overbought, and when it is below 30, it is considered oversold. Traders can use this information to make informed trading decisions. For example, when the RSI is above 70, it may be time to sell the asset, and when it is below 30, it may be time to buy.

Another way to use the Relative Strength Index is to look for divergence. Divergence occurs when the RSI and the price action of the asset are moving in opposite directions. For example, if the price of the asset is making a series of higher highs while the RSI is making a series of lower highs, it may indicate that the asset is losing momentum and that a reversal may be imminent.

Traders can also use moving averages in conjunction with the Relative Strength Index to make informed trading decisions. For example, if the price of an asset is above its 50-day moving average, and the RSI is above 50, it may indicate that the asset is in an uptrend and that it may be time to buy. Conversely, if the price of the asset is below its 50-day moving average, and the RSI is below 50, it may indicate that the asset is in a downtrend and that it may be time to sell.

Relative Strength Index

How to Use Relative Strength Index

The RSI can be used in a variety of ways to make informed trading decisions. Some of the most common ways to use the RSI include:

  1. Overbought and Oversold Conditions

The most common use of the Relative Strength Index is to identify overbought and oversold conditions in the market. When the RSI is above 70, it is considered overbought, and when it is below 30, it is considered oversold. Traders can use this information to make informed trading decisions. For example, when the RSI is above 70, it may be time to sell the asset, and when it is below 30, it may be time to buy.

  1. Divergence

As mentioned earlier, divergence occurs when the Relative Strength Index and the price action of the asset are moving in opposite directions. Divergence can be a powerful tool for traders to identify potential trend reversals. When the RSI is making a series of higher lows while the price action is making a series of lower lows, it may indicate that a bullish reversal is imminent. Conversely, when the RSI is making a series of lower highs while the price action is making a series of higher highs, it may indicate that a bearish reversal is imminent.

  1. Trend Confirmation

The RSI can also be used to confirm trends. When the price of an asset is trending higher, the RSI will typically remain above 50, and when the price is trending lower, the RSI will typically remain below 50. Traders can use this information to confirm trends and make informed trading decisions.

  1. Overlapping Timeframes

Another way to use the Relative Strength Index is to look for overbought and oversold conditions on overlapping timeframes. For example, if the RSI on the daily chart is above 70, but the RSI on the 4-hour chart is below 30, it may indicate that a trend reversal is imminent.

  1. Moving Averages

Traders can also use moving averages in conjunction with the RSI to make informed trading decisions. For example, if the price of an asset is above its 50-day moving average, and the RSI is above 50, it may indicate that the asset is in an uptrend and that it may be time to buy. Conversely, if the price of the asset is below its 50-day moving average, and the RSI is below 50, it may indicate that the asset is in a downtrend and that it may be time to sell.

Conclusion

In conclusion, the Relative Strength Index (RSI) is a popular technical analysis indicator used by traders to determine overbought and oversold conditions in the market. The RSI can be used in a variety of ways to make informed trading decisions, including identifying overbought and oversold conditions, divergence, trend confirmation, overlapping timeframes, and moving averages.

As with any trading indicator, the Relative Strength Index should be used in conjunction with other indicators and technical analysis tools to make informed trading decisions. Traders should also be aware of the limitations of the RSI, including false signals and the potential for the RSI to remain in overbought or oversold conditions for extended periods.

Overall, the RSI is a powerful tool for traders to add to their technical analysis toolkit, and with proper usage, it can help traders maximize their trading profits.