Momentum Trading Algorithm: Navigating Market Trends for Trading Success

Momentum Trading Algorithm

Introduction

In the fast-paced world of financial markets, algorithmic trading has become the backbone of many trading strategies. Among them, the momentum trading algorithm stands out, designed to capitalize on existing market trends and leverage them for profit.

Understanding Momentum in Trading

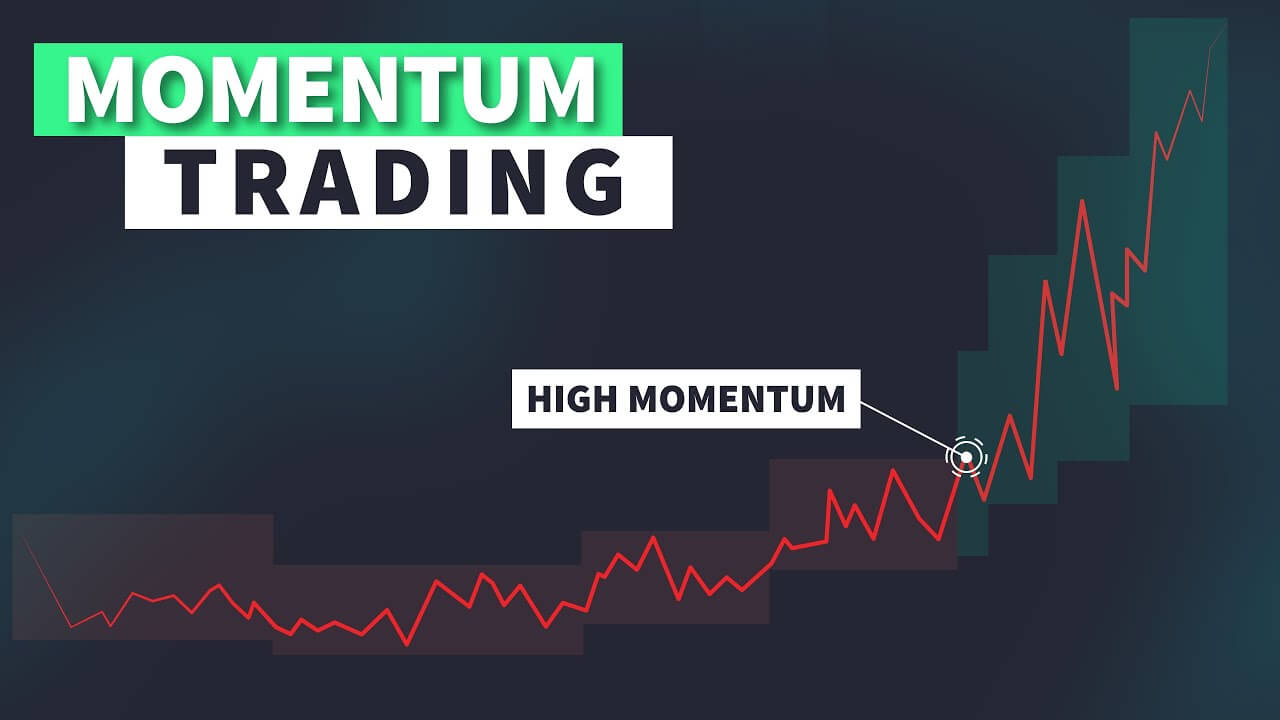
Momentum, in trading, can be visualized as a train in motion. The idea is simple: buy securities that are moving upwards and sell those on a downtrend. However, identifying this momentum requires a more analytical approach. This is where tools such as Moving Averages and the Relative Strength Index (RSI) come into play. These indicators, among others, provide traders with a clear snapshot of market momentum, acting as the foundation for the momentum trading algorithm.

The Core Components of a Momentum Trading 

Data Acquisition

Every momentum trading  begins its journey with data. The quality and timeliness of the data fed into the system play a crucial role in its overall performance. Real-time data, sourced from reliable feeds, provides the algorithm with the raw material it needs to gauge market movements. This data typically includes price movements, trade volumes, and any other pertinent market metrics that can influence momentum.

Signal Generation

Signal generation is arguably the heart of this trading algorim. Here, the algorithm processes the acquired data using predefined sets of rules to determine potential trading opportunities. These rules often center on momentum indicators, such as Moving Averages or the Relative Strength Index (RSI). When certain conditions are met, the algorithm generates a signal, either to buy or sell a security.

Execution

Once a signal is generated, the next step for the momentum trading algorithm is execution. Automated trading ensures that orders are placed swiftly and efficiently in the market. The speed at which these algorithms operate gives them an edge over manual trading, as they can execute trades within milliseconds of identifying an opportunity. This rapid response is especially vital in volatile markets, where momentum can change quickly.

Risk Management

While the primary goal of  momentum trading is to identify and act on profitable trading opportunities, it’s equally vital to consider the associated risks. As a result, integrated risk management features are essential. These might include setting stop-loss levels, which automatically sell a security if its price drops to a certain level, or take-profit levels, which sell the security once it reaches a desired profit margin. This automated risk management ensures that the trader’s exposure is limited and aligns with their risk tolerance.

Feedback Loop

An often-overlooked component of the momentum trading algorithm is the feedback loop. After every trade, the algorithm evaluates the outcomes against its predictions. This self-assessment allows the algorithm to refine its rules and adapt to changing market conditions. The feedback loop ensures that the system remains dynamic and can evolve in line with market trends and behaviors.

Benefits of a Momentum Trading Algorithm

Efficient Data Processing One of the standout benefits of the momentum trading algorithm is its capacity to process vast amounts of data at lightning speed. Unlike human traders who may struggle to analyze multiple data sources simultaneously, the momentum trading algorithm seamlessly interprets live data feeds, ensuring that traders have access to real-time insights into market movements.

Emotionless Trading Decisions Human emotions can often skew trading decisions, leading to potentially costly mistakes. The momentum trading algorithm, being a machine, is devoid of emotions. It strictly adheres to predefined rules, ensuring that trades are executed based on logic and analysis rather than sentiment. This eliminates the potential pitfalls of fear, greed, or overconfidence that might affect manual trading.

Speed of Execution In the world of trading, speed can make all the difference between a profitable trade and a missed opportunity. The momentum trading algorithm’s ability to execute trades almost instantaneously gives traders a significant edge. When a market signal aligns with the algorithm’s criteria, trades are made swiftly, capitalizing on fleeting market momentum.

Continuous Market Monitoring The momentum trading algorithm doesn’t need to rest, eat, or sleep. It offers continuous market monitoring, scanning multiple instruments across various markets. This round-the-clock vigilance ensures that no potential trading opportunity, no matter how brief, goes unnoticed.

Enhanced Risk Management The momentum trading algorithm isn’t just about seizing opportunities; it’s also about safeguarding investments. Most algorithms come integrated with risk management features, such as setting stop-loss or take-profit levels. This ensures that even in volatile markets, the downside risk remains controlled and within a trader’s predefined limits.

Adaptability and Learning Many modern momentum trading algorithms incorporate machine learning techniques, allowing them to learn from past trades and adapt. This means that over time, the algorithm can refine its strategies, making it more attuned to specific market conditions or a trader’s unique risk profile.

Consistency in Strategy Application A well-defined trading strategy is only as good as its application. The momentum trading algorithm provides unmatched consistency. Every time a market condition aligns with the algorithm’s set parameters, the same trading action is taken, ensuring a uniform approach.

Diversification and Scalability With the ability to monitor several markets simultaneously, the momentum trading algorithm allows traders to diversify their portfolios effortlessly. Furthermore, as a trader’s strategy and capital grow, the algorithm can scale its operations, catering to an expanded set of instruments or a more significant trading volume.

Challenges and Considerations in 

Overfitting Issues

One of the most significant challenges faced in developing a momentum trading algorithm is overfitting. Overfitting occurs when the algorithm is too closely tailored to historical data. Instead of identifying genuine patterns and trends, an overfitted algorithm might end up “memorizing” past events, making it less adaptive and effective for future market scenarios. Traders must ensure that their momentum trading algorithm is designed to generalize from past data rather than reproduce it, ensuring it remains adaptable and responsive to new market data.

Handling Market Reversals

The essence of a momentum trading algorithm is to capitalize on prevailing market trends. However, markets are dynamic, and trends can reverse unexpectedly due to various reasons like geopolitical events, economic announcements, or global crises. A sudden market reversal can present challenges for momentum-based strategies, especially if the algorithm isn’t designed to recognize and adapt to rapid changes in market direction. Fine-tuning the momentum trading algorithm to incorporate mechanisms to detect potential reversals is crucial for long-term trading success.

Technological Vulnerabilities

While technology is the backbone of any algorithmic trading strategy, it also introduces its set of challenges. Connectivity issues, software bugs, or hardware failures can hinder the momentum trading algorithm’s performance, leading to missed opportunities or, worse, significant losses. Ensuring robust technological infrastructure, regular system checks, and having contingency plans in place is vital for those heavily reliant on momentum algorithmic trading.

Adapting to Changing Market Conditions

Financial markets are not static. They evolve based on a multitude of factors, including changes in economic policies, technological innovations, or shifts in investor sentiment. A momentum trading algorithm that performed exceptionally well in one market condition might struggle when the dynamics change. Traders need to ensure that their algorithms undergo periodic reviews and updates to remain relevant and effective in various market conditions.

Dependency and Over-reliance

There’s a tendency among traders, especially those new to the algorithmic trading world, to become overly reliant on their systems. While the momentum trading algorithm can offer significant advantages in terms of speed and efficiency, it’s essential to understand its limitations. No algorithm can predict market movements with absolute certainty. Blindly following the algorithm without understanding or oversight can lead to unforeseen risks and losses.

Regulatory and Ethical Concerns

As algorithmic trading, including the use of momentum trading algorithms, becomes more prevalent, it attracts the attention of regulatory bodies worldwide. Concerns about market manipulation, unfair advantages, and a lack of transparency have led to calls for more stringent regulations. Traders employing these algorithms need to be aware of the evolving regulatory landscape and ensure that their trading practices remain compliant.

Fine-Tuning the Algorithm: The Iterative Process

Understanding the Momentum Trading Algorithm’s Feedback Loop

At the heart of refining any algorithm lies the feedback loop. For a momentum trading algorithm, this loop is the process of executing trades, analyzing the outcomes, making necessary changes, and then testing those changes in real-time. This cycle continues repeatedly, ensuring the algorithm becomes more aligned with the trader’s objectives and the ever-evolving market dynamics.

Data Analysis and Performance Metrics

An essential step in fine-tuning a momentum trading algorithm is the analysis of data and performance metrics. This involves closely monitoring how the algorithm performs in various market conditions. For instance, does it effectively capture upward trends? How does it respond to sudden market reversals? By evaluating key performance indicators (KPIs), traders can gauge where the algorithm excels and where it requires improvement.

Adapting to Changing Market Dynamics

Financial markets are in a constant state of flux, driven by factors ranging from economic data releases to geopolitical events. A momentum trading algorithm that performed exceptionally well during a bullish market phase might struggle during a bearish or volatile phase. As a result, traders need to adjust the algorithm’s parameters to ensure it remains effective irrespective of market mood.

Avoiding Overfitting

One of the most common pitfalls when refining a momentum trading algorithm is overfitting. This occurs when the algorithm becomes too tailored to past data, making it less flexible and adaptive to new market scenarios. The iterative process involves ensuring that while the algorithm learns from its past trades, it doesn’t become overly rigid or hyper-specific in its decision-making process.

Manual Oversight and Periodic Reviews

While the power of a momentum trading algorithm lies in its automation, human intervention remains indispensable. Periodic reviews by traders ensure that the algorithm’s actions align with broader trading objectives and strategies. Sometimes, the human touch can identify nuances or market sentiments that might be overlooked by even the most sophisticated algorithms.

Integration of New Technologies

The technological landscape of trading is ever-evolving. New tools, data analytics platforms, and advancements in fields like artificial intelligence can offer fresh insights and capabilities. Integrating these into the momentum trading algorithm can significantly enhance its performance. The iterative process means staying abreast of these innovations and determining how they can be woven into the algorithm’s fabric.

Diversification in Momentum Algorithmic Trading

  • To initiate our conversation on diversification in the sphere of momentum algorithmic trading, we must first acknowledge the inherent nature of momentum strategies. Generally, a momentum trading  identifies and seeks to capitalize on market trends, betting on the continuation of a prevailing trend based on various technical indicators. While this approach often yields appreciable returns, the reliance on a single strategy can sometimes amplify the risks, especially during market reversals or periods of heightened volatility.Therefore, the role of diversification emerges as a potent tool to balance and mitigate these risks. The first pillar of diversification involves integrating various trading strategies alongside the momentum trading algorithm. For instance, incorporating mean reversion strategies, which bet on price corrections, can serve as a counterbalance to momentum strategies, offering a hedge during sudden market reversals.

    Furthermore, the momentum trading algorithm can be fine-tuned to explore different time frames. Whereas one algorithm might focus on short-term trends, capturing gains from minute-by-minute fluctuations, another might have a medium to long-term focus, seeking to profit from sustained market movements over weeks or months. This temporal diversification can sometimes yield uncorrelated results, providing a protective buffer to the investment portfolio.

    Asset diversification stands as another critical component in this diversification narrative. A well-rounded momentum trading algorithm does not confine itself to a single market or asset type. It explores equities, commodities, currencies, and even cryptocurrencies, each having distinct market dynamics and cycles. This expansive approach allows traders to capitalize on opportunities in one market when another is experiencing a downturn, thus maintaining a steady growth trajectory.

    But diversification is not solely confined to trading strategies and asset types; it also embraces geographical diversification. A savvy trader employing a momentum trading might scan opportunities globally, identifying trends in various markets around the world. This global approach can potentially unveil lucrative opportunities, especially in emerging markets with different economic cycles compared to established markets.

    Moreover, to foster robust diversification, it is essential to continually monitor and adjust the portfolio based on changing market conditions. This dynamic approach ensures that the momentum trading algorithm remains adaptable, capable of pivoting strategies as needed to maintain a well-diversified portfolio.

Ethical Considerations in Algorithmic Trading

Potential for Market Manipulation

At the heart of the ethical debate is the potential for market manipulation. Momentum trading algorithms, by their very nature, respond to and, in some cases, amplify existing market trends. When numerous algorithms act in concert, either by coincidence or design, they can lead to exaggerated market movements. For example, if multiple momentum trading algorithms identify a stock as having positive momentum and begin buying en masse, they can artificially inflate the stock’s value, leading to potential bubbles.

Transparency and Fairness

The opaque nature of algorithmic strategies, including momentum trading algorithms, poses another ethical concern. Many of these algorithms are proprietary, meaning their exact workings and strategies are closely guarded trade secrets. While this is understandable from a competitive standpoint, it raises questions about fairness. Can the average investor truly compete in a market dominated by algorithms they don’t understand and can’t see?

Accessibility and Equal Playing Ground

The resources required to develop, deploy, and maintain a sophisticated momentum trading algorithm are substantial. This often means that only large financial institutions or well-funded hedge funds can afford to engage in high-level algorithmic trading. This creates a potential divide between institutional traders and retail investors, raising concerns about creating an uneven playing field where only the elite can benefit from the most advanced trading tools.

Overreliance and Systemic Risk

Momentum trading algorithms, as with other automated strategies, run the risk of traders becoming over-reliant on them. When these algorithms encounter a scenario they aren’t designed for, they might act unpredictably, leading to significant losses. If many traders and institutions rely on similar algorithms, and these algorithms all behave in an unanticipated manner simultaneously, it could introduce systemic risk into the financial markets.

Accountability in Autonomous Decisions

As the momentum trading makes decisions autonomously, an ethical question arises regarding accountability. If an algorithm makes a trade resulting in substantial market disruption or loss, who is responsible? The developer who coded the algorithm? The trader who deployed it? Or the institution that backs the trader?

Future Ethical Considerations

With technology continually advancing, new ethical considerations will inevitably emerge. The integration of machine learning and artificial intelligence into momentum trading algorithms can lead to systems that learn and evolve on their own. This self-evolution further complicates the ethical landscape, making transparency and accountability even more critical.

The Future of Momentum Trading Algorithms

Integration with Advanced Technologies

The most significant push for the momentum trading  will likely come from other sectors of technology. Artificial Intelligence (AI) and Machine Learning (ML) are poised to play pivotal roles in refining and enhancing the efficiency of the momentum trading algorithm. By leveraging these technologies, algorithms can learn from vast datasets, identifying even subtle patterns and nuances in market behavior that might escape human analysis.

Customization and Personalization

With advancements in computational power and data analytics, the next wave of momentum trading algorithms may offer unprecedented levels of customization. Traders might be able to tailor algorithms more closely to their unique trading styles, risk appetite, and financial goals. This heightened level of personalization would not only improve trade efficiency but also align more closely with individual trader objectives.

Global Market Interactions

As markets become more interconnected, the momentum trading algorithm’s ability to operate seamlessly across diverse markets will be crucial. Algorithms will be designed to draw insights from global market trends, considering variables from different economies, time zones, and asset classes. This global perspective will allow traders to capitalize on momentum trends that span across borders.

Enhanced Risk Management

Risk is an inherent part of trading. However, the future momentum trading algorithm will likely be equipped with even more sophisticated risk management features. Predictive analytics, paired with real-time market data, will allow the algorithm to forecast potential market downturns or volatility spikes, adjusting trading strategies on-the-fly to mitigate potential losses.

Regulatory and Ethical Evolution

The prominence of the momentum trading algorithm will undoubtedly catch the attention of regulatory bodies. As these algorithms grow in influence, there will be a concerted effort to ensure transparency, fairness, and ethical considerations in their operations. Traders and developers alike will need to navigate an evolving regulatory landscape, ensuring that algorithms operate within established guidelines while still maximizing their potential.

Evolving with Market Dynamics

One constant in financial markets is change. As market dynamics shift due to geopolitical events, economic policies, or global crises, the momentum trading algorithm will need to be agile. Continuous refinement and adaptation will be paramount. Developers will work tirelessly to ensure that their algorithms remain relevant, effective, and attuned to the latest market realities.

Conclusion

In the intricate dance of financial markets, the momentum trading algorithm has carved a niche for itself. By intelligently harnessing market trends, it offers traders an edge in their pursuit of profitability. As technology continues to shape trading’s future landscape, the momentum trading algorithm will undoubtedly remain a crucial player, evolving and adapting to the market’s ever-changing rhythm.

MT5 Strategy Tester: The Ultimate Guide for Modern Forex Traders

MT5 Strategy Tester
MT5 Strategy Tester

Introdution

The rapid advancements in forex trading tools have brought about innovative platforms that allow traders to navigate markets more efficiently. One such progression is the shift from MT4 to MT5. Central to this discussion is the MT5 strategy tester – an indispensable tool for contemporary forex traders. This article will uncover the multifaceted aspects of this strategy tester, emphasizing its pivotal role in refining trading strategies.

The Advancements from MT4 to MT5 Strategy Tester

While MT4 has cemented its legacy in the world of forex trading, MT5 comes with a suite of enhanced features, especially within its strategy tester. The MT5 strategy tester doesn’t merely offer an upgrade but a comprehensive evolution. Unlike its predecessor, the MT5 variant introduces multi-timeframe and multi-currency testing, allowing traders to gauge a strategy’s efficacy across various market scenarios.

Delving into MetaTrader5 Strategy Tester Features

  1. Intuitive User Interface:

    Upon launching the MT5 strategy tester, users are greeted with a clean, streamlined interface that maximizes user engagement and minimizes confusion. Icons are clearly labeled, and functions are logically grouped, ensuring that even newcomers to the platform can navigate with ease.

  2. Cloud Testing:

    One standout feature of this strategy tester is cloud testing. Traditional backtesting, reliant on a single machine’s resources, can be both time-consuming and limiting. Cloud testing in MT5 harnesses distributed computing, using resources from various devices connected to the MQL5 Cloud Network. This not only expedites the testing process but also offers more extensive data sets for accurate results.

  3. Genetic Optimization:

    It employs genetic algorithms, a game-changer in the realm of backtesting. Instead of sequentially testing each parameter set, this feature intelligently selects and tests combinations, speeding up the optimization process. Genetic optimization identifies promising areas in the solution space and focuses its efforts there, reducing the time spent on less promising scenarios.

  4. Multi-timeframe Testing:

    Another facet where this strategy tester shines is in its capability to test strategies across multiple timeframes simultaneously. Whether you’re a long-term trader or a scalper, this feature ensures that your strategies are viable across varying market conditions, offering a holistic view of potential strategy performance.

  5. Real-time Visual Testing:

    Visual learners, rejoice! This tester incorporates a real-time visual testing feature. This allows traders to witness their strategies in action against historical data, complete with graphical indicators and oscillations. This visual rendition makes it simpler to spot patterns, inefficiencies, or areas of potential refinement within a strategy.

  6. Custom Symbols:

    The MT5 strategy tester offers a level of customization that’s unparalleled. Traders can now incorporate custom symbols into their testing, crafting a backtesting environment tailored to specific needs. This feature allows traders to simulate trading conditions closely aligned with real-life scenarios, ensuring more accurate and relevant results.

  7. Forward Testing:

    While backtesting is pivotal, the MT5 strategy tester also accommodates forward testing, enabling traders to test strategies on a demo account in real-time. This acts as a bridge between historical backtesting and live trading, ensuring that strategies are not just suited to the past but are also resilient in the present market landscape.

Understanding Custom Symbols in MT5 Strategy Testing

What Are Custom Symbols?

In the vast realm of forex trading, symbols typically represent currency pairs or other assets traders are looking to trade. Custom symbols, as facilitated by the MT5 strategy tester, allow traders to create their unique trading instrument. This is a game-changer. It means traders aren’t just limited to default symbols or assets provided by their brokers. They can virtually craft their instruments, setting parameters and conditions that mirror their specific trading needs or market anticipations.

Why Custom Symbols Matter in the MetaTrader5 Strategy Tester

  1. Real-world Simulations: With custom symbols, traders can simulate real-world trading scenarios more accurately. This becomes especially crucial when backtesting strategies against historical data. It ensures that the data being tested is not just generic but finely-tuned to specific trading conditions.
  2. Greater Control: The MT5 strategy tester with custom symbols empowers traders. They can define the tick size, contract size, margin requirements, and even the mode of profit calculation for their custom instruments. This granular level of detail allows for more refined and nuanced strategy testing.
  3. Diverse Testing Scenarios: One of the challenges traders often face is the limitation of scenarios available for backtesting. With custom symbols in the MT5 strategy tester, this problem is alleviated. Traders can simulate diverse market conditions, testing their strategies against a plethora of scenarios, ensuring they’re robust and versatile.

Configuring Custom Symbols for Improved Testing Accuracy

Using custom symbols in the MT5 strategy tester demands a level of finesse. It’s not about creating symbols arbitrarily but aligning them with realistic market conditions.

  1. Importing Historical Data: For custom symbols to be effective, they need to be backed by accurate historical data. Traders can import data from various sources, ensuring their custom instruments have a strong foundational basis.
  2. Setting Parameters: Once the data is in place, traders can define specific parameters for their custom symbols. This includes setting spread values, swap conditions, and even trading schedules. The more detailed the configuration in the MT5 strategy tester, the more precise the backtesting results.
  3. Continuous Monitoring: Custom symbols, once created, aren’t static. As with any trading tool within the MT5 strategy tester, they require periodic reviews and adjustments to stay relevant and effective.

The Power of Visual Testing in MT5

An Intuitive Interface for the Modern Trader

At the heart of the MT5 strategy tester is its intuitive and user-friendly interface. As soon as traders embark on their visual testing journey, they’re greeted with a real-time simulation of their strategy playing out in the market. This isn’t just numbers and data on a screen; it’s a vivid representation, complete with charts, indicators, and even trade markers showcasing entry and exit points.

Bridging the Gap Between Theory and Practice

While numerical data and statistics play a pivotal role in strategy evaluation, visual testing in this strategy tester brings forth a tangible dimension. Traders can observe how their strategies would fare in real-life market conditions, bridging the gap between theoretical strategy constructs and practical market dynamics.

Swift Adjustments and Iterations

One of the standout features of visual testing through this tester is the ability to make swift adjustments. As the strategy unfolds visually, traders can instantly spot inefficiencies or areas of improvement. This immediate feedback loop allows for on-the-spot tweaks, optimizing the strategy without having to restart or run multiple tests from scratch.

Enhanced Interpretation of Complex Scenarios

The forex market is renowned for its volatility and complexity. There are instances where market movements and trend shifts might be challenging to decipher through mere numbers. However, with the MT5 strategy tester’s visual testing, these complex scenarios become more understandable. The visual representation can illuminate patterns, anomalies, or shifts that might otherwise go unnoticed in a traditional backtest.

Boosted Confidence in Strategy Deployment

Seeing is believing. By visually observing a strategy’s performance in the MT5 strategy tester, traders gain more confidence in its viability. It’s one thing to trust a strategy based on statistical output and another to have witnessed its execution, trade by trade, in a simulated market environment.

Interpreting Results from the MetaTrader5 Strategy Tester

Navigating the dynamic world of forex trading requires a robust understanding of the tools and data at one’s disposal. Central to this discourse is the MT5 strategy tester. Designed to provide traders with invaluable insights into the efficacy of their strategies, the MT5 strategy tester offers a suite of analytical tools that, when understood correctly, can significantly enhance trading decisions.

Diverse Array of Analytical Tools

This strategy tester is more than just a backtesting platform. It presents a plethora of analytical tools that serve varied purposes. From profit charts and detailed logs to trade graphs, it provides a comprehensive snapshot of how a trading strategy would perform over a specified period.

Profit Charts: The Financial Health Indicator

At the heart of trading is the ultimate goal: profitability. The MT5 strategy tester‘s profit chart displays a strategy’s performance over time, showcasing periods of gains and losses. This visual representation provides traders with an instant understanding of a strategy’s stability, potential profitability, and its resilience during market downturns.

Trade Graphs: A Granular View

Trade graphs in this strategy tester offer a granular view of each trade executed during the testing phase. By examining entry and exit points, traders can refine their strategies, tweaking them to better respond to specific market conditions.

Detailed Logs: The Devil is in the Details

Detailed logs are, perhaps, the unsung heroes of the MT5 strategy tester. They catalog every single event during the testing phase, from trade executions to modifications and closures. These logs are vital for traders who want to understand the nitty-gritty of their strategy’s performance. By examining these logs, traders can pinpoint anomalies, unexpected outcomes, or patterns that can be capitalized upon in future trades.

Balance and Equity Chart: Assessing Liquidity and Risk

The balance and equity chart provided by the MT5 strategy tester allows traders to visually differentiate between the account balance and the equity, which includes open trades. Understanding this distinction is paramount. It not only reveals the liquidity of an account at any given time but also offers insights into potential drawdown risks. If there’s a vast discrepancy between balance and equity, it might indicate that the strategy often has large open trades, which could be a risk factor.

Built-in Reports: Comprehensive Performance Assessment

An integral component of the MT5 strategy tester is its built-in reports section. These reports provide a bird’s-eye view of a strategy’s performance, highlighting key metrics like the profit factor, expected payoff, and drawdown percentages. These metrics, when considered collectively, can offer invaluable insights into the viability of a trading strategy. For instance, a high drawdown percentage might indicate higher risk, while a higher profit factor could signify potential profitability.

Optimization Considerations in MetaTrader5 Strategy Tester

Understanding the Core of Optimization 

The primary objective behind using this strategy tester for optimization is to identify the best set of parameters for a particular trading strategy. These parameters, such as entry and exit triggers, stop-loss levels, and take-profit points, can drastically influence the profitability of a strategy.

Role of Input Parameters

Input parameters play a pivotal role when optimizing with the MT5 strategy tester. They define the variables of your strategy that can be adjusted. For instance, if you’re testing a moving average crossover strategy, the lengths of the short and long moving averages are typical input parameters. Tweaking these lengths can offer insights into which combination provides the most favorable results.

Beware of Over-Optimization

One of the significant pitfalls traders face when using this strategy tester is over-optimization. While it’s tempting to refine a strategy until it shows near-perfect results on historical data, this can be deceptive. A strategy that’s too finely tuned to past data might perform poorly in real-time trading because it’s tailored excessively to fit that data, leaving it ill-equipped to adapt to new market conditions.

Leveraging Genetic Algorithms

The MT5 strategy tester introduces the concept of genetic algorithms for faster and more efficient optimization. Instead of testing every possible combination of parameters, which can be time-consuming, it employs algorithms that mimic the process of natural selection. This means the MT5 strategy tester identifies and propagates the most promising solutions, discarding sub-optimal ones, making the optimization process more streamlined and effective.

Adapting to Market Conditions

Market conditions are never static. They fluctuate based on a multitude of factors, from geopolitical events to economic indicators. Hence, while using the MT5 strategy tester, it’s essential to optimize strategies across various market scenarios. This ensures that the strategy remains robust, whether the market is trending, consolidating, bullish, or bearish.

Multi-threaded and Cloud Optimization

The sheer computational power required for extensive optimization can be daunting for individual systems. Thankfully, this tester offers multi-threaded optimization, distributing tasks across multiple cores of your computer. For even more power, traders can tap into the MT5’s cloud network, leveraging the combined processing prowess of thousands of computers globally.

Continuous Re-optimization

The dynamic nature of markets means that optimization isn’t a one-time process. As market conditions evolve, what was once a highly efficient strategy might lose its edge. Thus, periodically using the MT5 strategy tester for re-optimization ensures that your strategies remain in sync with the prevailing market rhythms.

Addressing Common Challenges with the MetaTrader5 Strategy Tester

  1. Over-optimization Dilemma

    One of the most prevalent challenges faced by traders using this strategy tester is over-optimization. In their quest to perfect a strategy, traders might fine-tune it excessively based on past data. While this may produce stellar results in backtesting, it doesn’t guarantee future success. Over-optimized strategies are tailored so meticulously to past data that they may fail to perform under new market conditions. It’s crucial to strike a balance and ensure that while refining a strategy, it remains versatile enough to adapt to the dynamic forex market.

  2. Scope of Testing and Market Conditions

    The vast capabilities of the MT5 strategy tester may sometimes lead traders to test their strategies in a limited scope, often biased towards specific market conditions. For instance, if a strategy is exclusively backtested during bullish market conditions, its efficacy during bearish or sideways market movements might remain unexplored. To leverage the MT5 strategy tester effectively, traders should ensure that their strategies are tested under diverse market scenarios, ensuring a well-rounded evaluation.

  3. The Curve Fitting Conundrum

    Curve fitting is a subtle trap that even seasoned traders may fall into. This tester offers an array of optimization parameters, making it tempting to adjust a strategy until it fits historical data perfectly. However, this creates a mirage of a flawless strategy. In reality, a curve-fitted strategy might underperform when exposed to new market data. While the MT5  tester provides the means to refine strategies, traders should be wary of overfitting them to historical data, as this could distort the strategy’s true potential.

  4. Hardware and Software Limitations

    As powerful as the MT5 strategy tester is, it’s also resource-intensive. Some traders might encounter sluggish performance or even crashes if their computer hardware isn’t up to par. It’s essential to ensure that the system meets the recommended specifications for MT5. Additionally, leveraging the cloud testing feature of the MT5  tester can help offset some of the computational loads, ensuring smoother backtesting sessions.

  5. Interpreting Results with Precision

    This strategy tester produces a wealth of data post-backtesting, from equity curves to detailed trade logs. For novice traders, this information overload can be daunting. Misinterpreting or overlooking critical data points can lead to flawed trading decisions. Familiarizing oneself with the various metrics and results generated by the MT5 strategy tester is pivotal. Continuous learning and perhaps seeking guidance from seasoned traders can aid in accurate interpretation.

Tips for Maximizing MetaTrader5 Strategy Tester Efficiency

Hardware Specifications

First and foremost, the hardware of your computer plays a significant role in determining the performance of this tester. The strategy tester is a powerful tool that requires substantial computational resources for optimal functionality. Upgrading your system to have a faster processor and higher RAM will ensure that the MT5  tester runs smoothly, performing backtests at a much quicker rate. Moreover, a good graphics card can enhance the visual testing experience, allowing for more detailed analyses.

Utilizing Cloud Network

The MT5 platform comes with a unique feature known as the MQL5 Cloud Network. This network permits traders to access more computational power by connecting to cloud resources. By leveraging the cloud network, the MT5 strategy tester can perform complex backtesting and optimization tasks at a significantly faster pace, saving you both time and effort. It’s an investment worth considering for serious traders looking to explore the intricate nuances of their strategies thoroughly.

Optimizing Input Parameters

One of the standout features of the MT5 strategy tester is its ability to fine-tune input parameters meticulously. Traders should spend time understanding the intricate settings available in the tester. Knowing how to optimally set these parameters can prevent over-optimization and ensure more realistic and reliable backtesting results. It’s crucial to maintain a balance between optimization and overfitting, where this tester can aid in finding the sweet spot for your strategy’s input parameters.

Frequent Updates

The MT5 platform is under continuous development, with frequent updates aimed at improving its functionalities and ironing out bugs. Regular updates to the platform ensure that the tester  functions at its best, offering enhanced features and improved stability. Utilizing the latest version of the MT5 strategy tester ensures you are always a step ahead, equipped with the most robust toolset for strategy testing.

Expert Advice and Community Engagement

Engaging with the MQL5 community can be a treasure trove of insights and tips on utilizing the MT5 strategy tester effectively. Experienced traders and developers often share valuable advice on maximizing the tester’s efficiency, discussing various optimization techniques, settings, and troubleshooting common issues. By being an active member of this community, you can garner insights that can help you harness the full power of this strategy tester.

Learning and Training

Despite its advanced features, the MT5 strategy tester is a tool that is most effective in the hands of a knowledgeable user. Investing time in learning the intricacies of this strategy tester, through tutorials and training sessions, can be immensely beneficial. Being adept with its functionalities allows you to explore and exploit the capabilities of this strategy tester fully.

Conclusion

The MT5  tester is not just a tool but a revolution for modern forex traders. Its array of features, combined with unparalleled flexibility, sets it apart. As markets continue to evolve, tools like the MT5 strategy tester become indispensable. For traders aiming to stay ahead, mastering this tool isn’t just recommended; it’s imperative.

MT4 Strategy Tester Spread: Unlocking the Secrets of Forex Trading

MT4 Strategy Tester Spread

Introduction

In today’s digital era of forex trading, understanding the intricacies of the tools at your disposal can mean the difference between profit and loss. One such essential tool is the MetaTrader 4 platform, more commonly known as MT4. This platform is cherished for its user-friendly interface, vast array of technical indicators, and most notably, the MT4 strategy tester. This article delves into the interplay between the MT4 strategy tester and spread, an essential yet often misunderstood element in forex trading.

Understanding the Basics

The MT4 is a renowned trading platform used by millions of forex traders worldwide. It offers an array of features, but the MT4 strategy tester remains one of its most compelling components. This function enables traders to backtest and optimize their strategies against historical data, ensuring that they’re viable before being deployed in live markets.

Now, spread is the difference between the buying and selling price of a currency pair. In essence, it’s the broker’s fee for executing your trade. In forex trading, spread can significantly impact the profitability of your strategies. Hence, understanding its dynamics is paramount.

MT4 Strategy Tester: A Deeper Look

MT4 strategy tester provides a simulation of how a trading strategy would perform over a given period. Traders can see potential profits, losses, and get a feel for the strategy’s overall viability. However, when discussing the MT4 strategy tester spread, it’s crucial to recognize how this element can skew these results.

The strategy tester considers various parameters, and one of them is the spread. If not adjusted or accounted for correctly, the spread can provide misleading backtesting results, potentially leading to flawed trading decisions.

Incorporating Spread in MT4 Strategy Tester

Understanding the Default Setting

As you venture into the use of MT4 strategy tester, it’s imperative to note that it comes with a default spread setting. This setting, while convenient, may not always mirror the actual market conditions. Consequently, traders looking to get a realistic assessment of their strategies must delve deeper into the nuances of the MT4 strategy tester spread to ensure precise backtesting results.

Necessity to Adjust Spread Settings

In the complex domain of forex trading, the incorporation of an accurate spread in the MT4 strategy tester cannot be stressed enough. It’s crucial to manually adjust the spread settings to avoid the potential pitfall of relying on static spreads. A realistic approach to testing involves mimicking the live market as closely as possible, and tinkering with the MT4 strategy tester spread settings can provide a gateway to more reliable outcomes.

Variability of Spread

One of the pivotal aspects to focus on while incorporating spread in MT4 strategy tester is understanding the inherent variability of spread in the forex market. The mt4 strategy tester spread needs to be adjusted to accommodate for the changing market conditions that can influence the spread dynamics considerably. Incorporating this variability can help simulate a more realistic trading environment, thus refining your strategy further.

Customizing Spread Parameters

Delving deeper into the MT4 strategy tester spread settings, traders have the option to customize spread parameters to align with different trading sessions and market conditions. Customizing these parameters can provide a more nuanced and realistic representation of market conditions, facilitating more accurate strategy testing outcomes.

The Significance of Historical Spread Data

In the process of incorporating spread in MT4 strategy tester, utilizing historical spread data can play a critical role. By analyzing past data, traders can forecast potential spread patterns, providing a more grounded approach to backtesting. This nuanced method, utilizing the MT4 strategy tester spread in conjunction with historical data, can potentially lead to more reliable and realistic results.

Real-Time Simulation and Spread Incorporation

An advanced approach towards making the most of MT4 strategy tester spread settings is real-time simulation. This technique involves adjusting the spread settings dynamically to mirror the real-time market conditions. Through this, traders can achieve a more rounded view of how their strategies might fare in the live market, accounting for the fluctuating spread dynamics.

The Impact of Spread on Trading Results

What is Spread?

At its core, spread is the difference between the bid (buy) and ask (sell) prices of a currency pair. It essentially represents the broker’s commission for executing a trade, aside from any other transaction fees. The size of the spread can vary based on the broker, the time of day, market conditions, and the specific currency pair being traded.

How Spread Influences Trade Entries and Exits

Imagine you’re executing a short-term trading strategy. Your analysis, possibly supported by the MT4 strategy tester, indicates a potential profit opportunity. However, because of the spread, your trade starts in a slight loss equivalent to the spread size.

For trades that target a small number of pips, the mt4 strategy tester spread becomes crucial. If the spread is large, it might eat into a significant portion of your anticipated profit. In such scenarios, the trade must move more in your favor just to break even.

The Role of Spread in Stop-Loss and Take-Profit Orders

Setting a stop-loss is a risk management technique used by traders to limit potential losses. However, the spread can influence when these stop-loss orders are hit. For instance, during times of high market volatility, spreads can widen. If you’re using the MT4 strategy tester, spread adjustments might be necessary to ensure that backtested stop-loss levels match those of live trading conditions.

Similarly, take-profit orders can also be affected. A widened spread might mean that your take-profit order is executed earlier than anticipated, potentially cutting into your profits.

MT4 Strategy Tester Spread in Backtesting

Backtesting, as facilitated by tools like the MT4 strategy tester, allows traders to simulate how a strategy would perform using historical data. The mt4 strategy tester spread is a critical parameter in this simulation. By default, the tester might use a standard spread, which might not always represent actual trading conditions.

If a trader doesn’t adjust for the mt4 strategy tester spread, the backtesting results might present an overly optimistic (or pessimistic) view of a strategy. This can lead to misguided confidence or undue skepticism about the strategy’s effectiveness.

Spread’s Impact on Overall Profitability

Over the course of numerous trades, especially in high-frequency trading scenarios, the cumulative effect of spreads becomes evident. Even if individual spreads seem minimal, their aggregate impact can be substantial.

Using the mt4 strategy tester spread adjustment can help traders visualize this cumulative effect. By analyzing strategies with varying spread conditions in the MT4 strategy tester, traders can get a clearer picture of potential profitability or vulnerability in different market environments.

Optimizing Spread Settings for Different Market Conditions

1. Understanding Spread in the Forex Market

Before diving into the intricacies of the MT4 strategy tester spread, it’s vital to grasp what the spread represents. Simply put, the spread is the difference between the buying and selling price of a currency pair. This difference essentially represents the broker’s fee for executing your trade. Given its constant presence in every trade, its magnitude, especially during varying market conditions, can significantly influence trading results.

2. MT4 Strategy Tester: A Recap

The MT4 strategy tester is a revered tool that allows traders to backtest their strategies against historical market data. By simulating trades over past periods, traders get insights into a strategy’s potential profitability, risks, and overall viability. However, to ensure accuracy, the MT4 strategy tester spread settings need to mirror real-world conditions, which brings us to the crux of our discussion.

3. Spread Variability and Market Conditions

Forex spreads aren’t static. They can fluctuate based on several factors like market volatility, liquidity, and significant news events. For instance, during high-impact economic news releases, the forex market can experience increased volatility, leading to widened spreads. Conversely, during off-market hours or periods of low volatility, spreads might narrow.

4. Adjusting MT4 Strategy Tester Spread for Market Volatility

Given the dynamic nature of spreads, when backtesting in the MT4 strategy tester, spread settings need optimization for the specific market condition being analyzed. Here’s how:

  • High Volatility Conditions: If backtesting a strategy during periods of high market volatility (e.g., economic news releases), adjust the MT4 strategy tester spread settings to reflect wider spreads typical of such times. This ensures the strategy is tested under the pressures of rapid market movements and broader spreads.
  • Low Volatility Conditions: Conversely, if examining a strategy’s effectiveness during quieter market periods, narrow the spread settings in the MT4 strategy tester. This simulates conditions where the market might move more sluggishly, and spreads are typically tighter.

5. Historical Spread Data and the MT4 Strategy Tester

One approach to enhance the accuracy of your MT4 strategy tester spread adjustments is by utilizing historical spread data. Some brokers provide data on past spread behaviors. By integrating this data into the MT4 strategy tester, traders can ensure their backtesting spread settings more closely resemble the real conditions at that time.

6. Continuous Optimization and Monitoring

The quest for accurate backtesting doesn’t end at a single adjustment. As markets evolve, so do spread behaviors. Regularly updating the MT4 strategy tester spread settings ensures that your strategies are tested under the most current and relevant conditions. This continuous optimization paves the way for more reliable backtesting results, equipping traders with strategies that can withstand the test of real-world trading.

Common Misconceptions about Spread in MT4 Strategy Testing

  1. Fixed Spread Equals Consistency
    • Misconception: Many traders believe that using a fixed spread in the MT4 strategy tester will ensure consistent and reliable results, assuming that real markets also have constant spreads.
    • Reality: Even brokers that offer fixed spreads can have moments of increased volatility where the spread widens. When using the MT4 strategy tester spread for backtesting, relying solely on fixed spreads can provide a misleading representation of potential strategy performance.
  2. Lower Spread Always Means Higher Profit
    • Misconception: There’s a prevalent belief that strategies tested with a lower MT4 strategy tester spread will always yield more profitable results.
    • Reality: While a lower spread can mean reduced trading costs, it doesn’t account for other market factors like volatility, slippage, or market news. It’s essential to test strategies under a variety of spread conditions to gauge their true effectiveness.
  3. MT4 Strategy Tester Spread Matches Live Trading Conditions
    • Misconception: Some traders assume that the spread they set in the MT4 strategy tester will match the spread they experience in live trading.
    • Reality: The MT4 strategy tester spread is a simulation. Even if you set it based on historical data or broker averages, real-time trading can see spread fluctuations that deviate from your test settings.
  4. All Strategies Need the Same Spread Settings
    • Misconception: A common oversight is believing that all trading strategies, whether short-term scalping or long-term positional trading, should use the same MT4 strategy tester spread settings.
    • Reality: Different strategies can be more or less sensitive to spread variations. Scalping strategies, which rely on small price movements, might be more affected by spread changes than longer-term strategies. It’s essential to adjust the MT4 strategy tester spread based on the specific strategy being tested.
  5. Historical Spread Data Isn’t Necessary
    • Misconception: Some traders think that using a generic spread setting in the MT4 strategy tester is sufficient, sidelining historical spread data’s significance.
    • Reality: Incorporating historical spread data can provide a more accurate representation of market conditions. By integrating this data into the MT4 strategy tester spread settings, traders can simulate more realistic testing scenarios.
  6. Spread Doesn’t Affect Stop Loss and Take Profit Points
    • Misconception: Traders might believe that spread only affects entry points and not stop loss or take profit levels.
    • Reality: The MT4 strategy tester spread can influence where stop loss or take profit triggers are hit. Not accounting for this can lead to strategies appearing more or less profitable than they truly are.

Tips for Traders

  1. Dive Deep into MT4’s Settings:
    Before anything else, familiarize yourself with all the functionalities of the MT4 platform. When using the MT4 strategy tester, make sure you are not just using the default settings. Adjust the spread settings according to the trading conditions you want to simulate, ensuring a more realistic testing environment.
  2. Always Account for Variable Spreads:
    Most traders who utilize the MT4 strategy tester spread sometimes forget that the forex market doesn’t always offer a fixed spread. Depending on market volatility and liquidity, spreads can widen or narrow. Make it a habit to always account for variable spreads in your strategy testing to avoid nasty surprises.
  3. Consistent Re-testing:
    The forex market is dynamic, with constant changes. As such, a strategy that worked wonders a few months ago might not be as effective today. Regularly using the MT4 strategy tester spread settings to re-test your strategies ensures they remain relevant and effective in the current market conditions.
  4. Factor in Costs:
    When assessing the profitability of a strategy using the MT4 strategy tester, always factor in the spread as a cost. Remember, spread represents the broker’s fee for executing your trade. Ignoring this can lead to overestimating the potential profitability of a strategy.
  5. Simulate Extreme Conditions:
    While it’s essential to test strategies in regular market conditions using the MT4 strategy tester spread settings, don’t forget to simulate extreme conditions. These could include high volatility periods like major news releases. Understanding how your strategy performs during such times is crucial for comprehensive preparation.
  6. Stay Updated:
    Brokers might occasionally adjust their spread offerings. Stay updated on these changes and adjust your MT4 strategy tester spread settings accordingly. This ensures your backtests remain as close to real market conditions as possible.
  7. Educate Yourself:
    The MT4 strategy tester spread is just one of many components in forex trading. Continuously educate yourself on market trends, news, and other tools available in the MT4 platform. The more informed you are, the better your trading decisions will be.
  8. Practice Makes Perfect:
    Before implementing a new strategy, practice it in a demo environment first. While the MT4 strategy tester spread can give you insights on paper, executing trades in real-time, even in a simulated environment, can offer invaluable experience.

Conclusion

The intertwining of MT4 strategy tester spread is undeniable. Understanding this relationship is crucial for any trader aspiring for consistent profitability. By incorporating accurate spread data in backtesting and staying aware of its impact in live trading, traders arm themselves with the knowledge to navigate the ever-changing forex market landscape.

MT4 Strategy Tester: Mastering Forex Trading with MetaTrader 4

Introduction

In the fast-paced world of Forex trading, having a reliable tool to test and refine your strategies is paramount. MetaTrader 4 (MT4), one of the most popular trading platforms. In this article, we’ll delve deep into the world of MT4 Strategy Tester, exploring its features, benefits, and how it can help traders make informed decisions. If you’re looking to take your Forex trading to the next level, understanding and utilizing the MT4 Strategy Tester is a crucial step.

Understanding MT4 Strategy Tester

Before we dive into the specifics, let’s clarify what the MT4 Strategy Tester is all about. In essence, it’s a tool designed to simulate trading strategies using historical market data. The primary goal is to evaluate how a particular trading strategy would have performed in the past. This process, known as backtesting, provides valuable insights into a strategy’s strengths and weaknesses.

Key Features of MetaTrader4 Strategy Tester

1. User-Friendly Interface

The journey with MT4 Strategy Tester begins with a user-friendly interface that welcomes traders of all experience levels. Whether you’re a seasoned pro or just starting your trading journey, the simplicity and intuitiveness of MT4’s interface make it accessible to everyone. This feature ensures that traders can easily navigate the tool and harness its power without being overwhelmed by complexity.

2. Customizable Testing Parameters

One of the standout features of MT4 Strategy Tester is its ability to adapt to the unique requirements of each trading strategy. Traders have the flexibility to customize a wide range of testing parameters, tailoring them to suit their specific needs. From selecting the currency pair and timeframe to defining initial deposit amounts and setting stop-loss and take-profit levels, this strategy tester offers control and customization that are indispensable for strategy development.

3. Historical Data Access

To accurately assess the performance of a trading strategy, access to high-quality historical data is paramount. MT4’s Strategy Tester provides just that. It offers traders access to extensive historical price data, allowing them to recreate past market conditions with precision. This access to reliable data is the foundation upon which accurate backtesting and strategy optimization are built.

4. Detailed Testing Models

MT4 Strategy Tester goes above and beyond by offering different testing models to cater to various trading styles and preferences. These models include:

  • Every Tick: Provides the most detailed simulation by considering every tick of historical data, offering a comprehensive view of a strategy’s performance.
  • Control Points: Strikes a balance between accuracy and speed, making it suitable for medium-accuracy testing.
  • Open Prices: Offers a faster but basic analysis by considering only open prices, ideal for quick assessments.

The availability of these testing models empowers traders to choose the level of detail and accuracy that best suits their strategy testing needs.

5. Realistic Visualization Tools

While numbers and statistics are crucial, a visual representation can often make complex data more digestible. This strategy tester excels in this aspect by offering a range of visualization tools. These tools allow traders to see how their strategies would have performed in a real-world scenario. By overlaying results on price charts, traders gain a clear visual understanding of where trades would have been executed and how they would have influenced the price movement. This feature helps traders analyze the strategic implications of their actions.

6. Performance Metrics and Analysis

MT4 Strategy Tester doesn’t just stop at simulating trades; it provides a comprehensive analysis of strategy performance. Traders can access a plethora of performance metrics, including:

  • Profit and Loss (P&L): Shows the hypothetical earnings and losses generated by the strategy.
  • Maximal Drawdown: Indicates the largest decline in the account balance before reaching a new peak.
  • Number of Trades: Provides insights into the trading frequency of the strategy.
  • Trade Metrics: Offers a breakdown of profitable and loss-making trades, allowing traders to evaluate the strategy’s win rate.

These performance metrics, combined with detailed analysis, empower traders to make informed decisions about their strategies.

How to Utilize MetaTrader4 Strategy Tester

1. Setting Up Tests in MetaTrader4 Strategy Tester

Before you can harness the power of the MT4 Strategy Tester, you need to set up your tests correctly. Here’s a step-by-step guide on how to do it:

  • Access the Strategy Tester: Within your MT4 platform, locate the Strategy Tester tool. You can usually find it in the “View” menu or by pressing “Ctrl+R.”
  • Select Currency Pair and Timeframe: Begin by selecting the currency pair you want to test. Choose a pair that aligns with your trading strategy. Next, specify the timeframe you wish to use for testing. Whether you are a scalper interested in the M1 chart or a swing trader looking at the D1 chart, MT4 Strategy Tester caters to your preferences.
  • Configuring Testing Parameters: This is where the magic happens. Configure various testing parameters to match your trading strategy. These parameters include the initial deposit amount, lot size, stop-loss and take-profit levels, and any other relevant settings. These settings should align with how you would implement the strategy in real trading.

2. Running Tests with MT4 Strategy Tester

With your testing parameters in place, it’s time to run your tests using the MT4 Strategy Tester:

  • Initiate the Test: Click the “Start” button in the Strategy Tester panel to begin the test. MT4 will use historical data to simulate the execution of your trading strategy.
  • Monitor the Progress: While the test is running, you can monitor the progress in real-time. The Strategy Tester provides detailed information about each trade, including entry and exit points.
  • Review the Results: Once the test is complete, review the results carefully. Pay attention to key metrics such as profit and loss, drawdown, and the number of trades executed. These metrics offer insights into how your strategy would have performed in the past.

3. Interpreting Results from MT4 Strategy Tester

Interpreting the results from your MT4 Strategy Tester runs is a critical step in the process. Here’s how to make sense of the data:

  • Profit and Loss: Assess the overall profitability of your strategy. Did it generate a profit, or did it result in losses?
  • Drawdown: Evaluate the drawdown, which represents the maximum decline in your account balance during the testing period. A lower drawdown indicates a less risky strategy.
  • Number of Trades: Consider the number of trades executed. Are there too few trades to make meaningful conclusions, or is the strategy excessively active?
  • Risk-Reward Ratio: Examine the risk-reward ratio for each trade. A favorable risk-reward ratio is often a sign of a well-structured strategy.
  • Equity Curve: Analyze the equity curve, which illustrates the growth of your account balance over time. A consistently rising curve is a positive sign.

Benefits of MetaTrader4 Strategy Tester

  1. Accurate Strategy Validation: One of the primary benefits of using the MT4 Strategy Tester is its ability to provide accurate validation of trading strategies. By backtesting your strategies using historical data, you can gain confidence that your approach has the potential to perform well in real market conditions. This validation process helps you avoid the common pitfall of entering the market with unproven strategies, significantly reducing the risk of losses.
  2. Risk Management and Optimization: MT4 Strategy Tester allows you to assess the risk associated with your trading strategies. You can fine-tune parameters such as stop-loss and take-profit levels to optimize your risk-reward ratio. This optimization process is essential for managing your capital efficiently and ensuring that you are not taking on excessive risks.
  3. Time Efficiency: In the fast-paced world of trading, time is a precious commodity. MT4 Strategy Tester streamlines the process of strategy evaluation, saving you valuable time. Instead of spending weeks or months testing a strategy in real-time, you can quickly assess its viability through backtesting. This time-saving aspect allows you to explore multiple strategies and find the ones that hold the most promise.
  4. In-Depth Analysis: The MT4 Strategy Tester provides in-depth analysis of your trading strategies. It offers a wide range of metrics, including profit and loss, drawdown, and the number of trades executed. These detailed insights enable you to pinpoint the strengths and weaknesses of your strategies. You can identify which aspects of your approach need improvement and take corrective action accordingly.
  5. Confidence Building: Trading can be emotionally challenging, especially for beginners. The MT4 Strategy Tester plays a crucial role in building trader confidence. When you see positive results from backtesting, you gain a sense of assurance in your strategies. This confidence is invaluable when it comes to executing trades in real-market conditions. It helps you stick to your trading plan and avoid making impulsive decisions driven by fear or greed.
  6. Strategy Optimization: The MT4 Strategy Tester allows you to fine-tune your trading strategies for optimal performance. By adjusting parameters, entry and exit rules, and other variables, you can identify the best settings for your strategy. This process of optimization can significantly enhance the profitability of your trades when applied to live trading.
  7. Flexible Testing Environments: MT4’s Strategy Tester offers flexibility in testing different trading environments. You can choose from various timeframes, currency pairs, and even specific historical data periods. This versatility enables you to adapt your testing to match your trading style and preferences, ensuring that your strategies are well-suited to the conditions you intend to trade in.
  8. Continuous Improvement: Successful traders are those who continually refine and adapt their strategies to evolving market conditions. MT4 Strategy Tester facilitates this process of continuous improvement. After live trading, you can retest and adjust your strategies based on the latest data, helping you stay competitive and profitable in dynamic markets.

Common Mistakes to Avoid 

1. Over-Optimization:

One of the most prevalent mistakes traders make with the MT4 Strategy Tester is over-optimization. This occurs when traders fine-tune their strategies to perform exceptionally well on historical data, but these strategies may not translate well to real-market conditions. Over-optimized strategies can suffer from what’s known as “curve-fitting,” where they are so tailored to historical data that they fail to adapt to changing market dynamics. To avoid this, it’s essential to strike a balance between optimizing for past performance and maintaining adaptability.

2. Ignoring Data Quality:

The accuracy and reliability of backtesting results depend heavily on the quality of historical data used in the MT4 Strategy Tester. Traders often overlook this critical aspect, assuming that all historical data is equal. In reality, data quality can vary, and using low-quality data can lead to inaccurate results. Gaps, errors, or inconsistencies in the data can significantly affect the outcome of a backtest. Therefore, it’s imperative to ensure that the historical data you use in the MT4 Strategy Tester is of high quality and free from any significant gaps or errors.

3. Neglecting Realism vs. Past Performance:

While backtesting with the MT4 Strategy Tester provides valuable insights into a strategy’s historical performance, it’s important to remember that past performance is not indicative of future results. Traders often make the mistake of assuming that a strategy’s success in backtesting guarantees success in live trading. Real-world market conditions can be unpredictable, and factors that weren’t present in historical data may come into play. It’s essential to view backtest results as a guide rather than a guarantee and to remain adaptable when trading live.

4. Overlooking Transaction Costs:

Transaction costs, such as spreads, commissions, and slippage, are an integral part of real-world trading but are often overlooked in backtesting with the MT4 Strategy Tester. Ignoring these costs can lead to unrealistic expectations of a strategy’s profitability. Traders may believe a strategy is highly profitable based on backtest results, only to find that transaction costs eat into their profits in live trading. To avoid this mistake, it’s crucial to incorporate realistic transaction costs into the backtesting process, providing a more accurate representation of a strategy’s performance.

5. Lack of Diversification:

Traders sometimes focus excessively on a single strategy or trading instrument when using the MT4 Strategy Tester. This lack of diversification can lead to significant risk exposure. While a strategy may perform well under specific conditions, it may struggle when market conditions change. To avoid this mistake, traders should consider diversifying their strategies and trading across different currency pairs or assets. Diversification can help mitigate risk and provide a more balanced trading approach.

6. Failure to Regularly Update Strategies:

A common mistake is assuming that a successful backtested strategy will remain profitable indefinitely. Market dynamics change, and what worked in the past may not work as effectively in the future. Traders often neglect the need to regularly update and adapt their strategies based on evolving market conditions. To prevent this error, it’s essential to periodically review and adjust strategies, incorporating new insights gained from ongoing backtesting and real-market experience.

Tips for Maximizing the Effectiveness of MetaTrader4 Strategy Tester

  1. Use Realistic Testing Conditions: When setting up your backtests in the MT4 Strategy Tester, strive to create conditions that closely mimic real-market scenarios. This includes considering factors like spreads, slippage, and market volatility. Realistic testing ensures that your strategies are better aligned with actual trading conditions.
  2. Vary Parameters Systematically: To avoid over-optimization, systematically vary the parameters of your trading strategy while using the MT4 Strategy Tester. Test different combinations of settings to determine the robustness of your strategy. This helps you find a balance between performance and adaptability.
  3. Regularly Review and Adjust: The Forex market is dynamic, and what works today may not work tomorrow. Use the insights gained from the MT4 Strategy Tester to regularly review and adjust your trading strategies. Keep them updated to remain in sync with changing market conditions.
  4. Backtest Multiple Timeframes: Don’t limit your testing to just one timeframe. The MT4 Strategy Tester allows you to test your strategies on various timeframes. This is essential because a strategy that works well on one timeframe may not perform as effectively on another. By testing across multiple timeframes, you gain a more comprehensive understanding of your strategy’s versatility.
  5. Include Out-of-Sample Testing: After conducting initial backtests using the MT4 Strategy Tester, set aside a portion of your data for out-of-sample testing. This data hasn’t been used in the initial testing phase. By doing this, you can assess how your strategy performs on unseen data, providing a more realistic measure of its effectiveness.
  6. Monitor Risk and Drawdown: While assessing the profitability of your strategy is important, it’s equally crucial to keep an eye on risk and drawdown. High profits might be appealing, but if they come with excessive risk, your strategy could be vulnerable to significant losses. Use the MT4 Strategy Tester to analyze risk metrics and set appropriate risk management parameters.
  7. Consider Multiple Asset Classes: If your trading strategy is not limited to a specific currency pair, expand your testing to include multiple asset classes. The MT4 Strategy Tester allows you to test strategies across various financial instruments, such as stocks, commodities, and indices. This broader perspective can help you identify strategies with wider applicability.
  8. Evaluate Different Entry and Exit Techniques: Experiment with various entry and exit techniques while using the MT4 Strategy Tester. Test different indicators, patterns, and signals to determine which combination yields the best results. This experimentation can lead to the discovery of more effective entry and exit points.
  9. Document Your Findings: Keep detailed records of your testing results in the MT4 Strategy Tester. Document what worked and what didn’t. This historical data can serve as a valuable reference point for future strategy development and optimization.
  10. Stay Informed: The Forex market is influenced by various economic and geopolitical events. Stay informed about global news and events that could impact currency movements. The insights gained from staying informed can complement the data you gather from the MT4 Strategy Tester.
MT4 Strategy Tester
MT4 Strategy Tester

Challenges and Limitations 

  1. Limited Real-World Dynamics: The primary limitation of the MT4 Strategy Tester is that it operates in a controlled environment using historical data. This controlled environment cannot fully replicate the dynamic and unpredictable nature of real-world markets. Therefore, strategies that perform exceptionally well in backtesting (mt4 strategy tester) may not necessarily translate to the same level of success in live trading.
  2. Data Quality and Accuracy: The accuracy and quality of historical data used in the MT4 Strategy Tester are critical. Inaccurate or incomplete data can lead to misleading results. Traders must ensure that they have access to high-quality historical data to obtain more reliable backtesting outcomes. Discrepancies in data quality can affect the accuracy of performance metrics, potentially leading to flawed conclusions.
  3. Assumption of Fixed Spreads: When using this Strategy Tester, it often assumes fixed spreads for backtesting purposes. However, real-world spreads can vary significantly, especially during periods of high market volatility. This limitation can impact the execution of trades in live trading, as spreads may widen, affecting the overall performance of a strategy.
  4. Lack of Slippage and Execution Realism: This Strategy Tester does not account for slippage and order execution realism. In reality, slippage occurs when orders are filled at prices different from the expected levels, which can affect profit and loss outcomes. Traders need to consider slippage when transitioning from backtesting (mt4 strategy tester) to live trading, as it can impact actual trading results.
  5. Inability to Capture News Events: One significant challenge is that the MT4 Strategy Tester cannot incorporate real-time news events or economic releases into backtesting scenarios. In live trading, unexpected news events can trigger rapid price movements, and strategies must adapt to these events. Backtesting alone cannot account for this real-time market reaction.
  6. Risk Management and Emotional Aspects: Backtesting focuses primarily on the technical aspects of a strategy’s performance, such as profitability and drawdown. It does not consider the emotional aspects of trading, including stress and decision-making under pressure. Traders may experience emotions differently in live trading compared to the controlled environment of backtesting.
  7. Curve-Fitting and Over-Optimization: Traders should be cautious about over-optimizing their strategies using this Strategy Tester. Over-optimization, also known as curve-fitting, occurs when a strategy is excessively tailored to historical data to achieve exceptional results. While such strategies may perform well in backtesting, they may fail in live markets due to their lack of adaptability.
  8. Limitations in Complex Strategies: Some advanced trading strategies, especially those involving multiple assets or complex rules, may not be effectively backtested using the MT4 Strategy Tester. These strategies may require more advanced testing platforms or manual analysis to evaluate their performance accurately.
  9. Backtesting Doesn’t Predict Future Results: Perhaps the most critical limitation to remember is that past performance, as evaluated through backtesting (mt4 strategy tester), does not guarantee future results. Market conditions can change, and unforeseen events can impact the performance of even well-tested strategies.

Conclusion

In the world of Forex trading, knowledge is power, and the MT4 Strategy Tester is your key to unlocking that power. By utilizing this tool effectively, traders can validate, refine, and optimize their trading strategies, ultimately increasing their chances of success in the dynamic world of Forex markets.

Strategy Tester MT4 Backtesting: Mastering Forex Trading with MetaTrader 4

Strategy Tester MT4 Backtesting

Introduction

The forex market is a vast and volatile space. Traders, in their quest to harness its opportunities, often rely on tools to give them an edge. MetaTrader 4, commonly known as MT4, stands as a giant in this field. While MT4 is praised for numerous features, one that often stands out is the strategy tester mt4 backtesting tool. This tool is a silent guardian, ensuring that traders don’t dive headfirst without testing the waters.

Deep Dive into MT4’s Strategy Tester

Backtesting, for the uninitiated, is the process of testing a trading strategy using historical data. The strategy tester mt4 backtesting tool offers this on a platter, allowing traders to simulate their strategies in past market conditions, thereby giving insights into potential future performance.

Configuring the Strategy Tester in MT4

1. Accessing the Strategy Tester: The first step to utilizing the strategy tester is to know where to find it. On the MT4 platform, navigate to the bottom panel. If it’s not already visible, you can access it by pressing ‘Ctrl + R’ or by selecting “View” from the top menu and then clicking on “Strategy Tester.”

2. Selecting the Right Expert Advisor (EA): At the heart of the strategy tester  is the ability to test automated strategies, known as Expert Advisors. Choose the EA you want to test from the drop-down list. Remember, the quality and efficiency of the EA can significantly influence your backtesting results.

3. Define Your Financial Instrument: Your chosen trading strategy might be tailored for a specific currency pair or another financial instrument. Use the “Symbol” dropdown to select the appropriate currency pair or instrument for your strategy tester mt4 backtesting.

4. Choose the Timeframe: Timeframes play a pivotal role in trading, and the MT4 strategy tester allows for a plethora of choices. Whether you’re backtesting a scalping strategy on a 5-minute chart or a long-term strategy on a daily chart, select the appropriate timeframe from the “Period” dropdown.

5. Specify the Date Range: For a robust strategy tester mt4 backtesting experience, deciding the span of historical data is crucial. Determine the ‘From’ and ‘To’ dates. The wider the date range, the more comprehensive your backtest will be, but it will also require more time.

6. Opt for a Testing Model: MT4 offers three distinct testing models:

  • Every Tick: This is the most accurate model, simulating each tick of data. Ideal for short-term strategies but can be time-consuming.
  • Control Points: A middle-ground approach, this model uses available timeframes and approximated data for timeframes that lack data.
  • Open Prices Only: The quickest model, suitable for strategies that don’t require detailed data.

7. Input Initial Deposit: For a realistic strategy tester mt4 backtesting session, input the virtual initial deposit. This mimics real trading conditions, giving you an idea of potential profits or losses relative to your starting capital.

8. Additional Settings: The “Use Date” checkbox allows you to enable or disable specific date ranges. The “Visual Mode” lets you visually observe the backtest in real-time. While it’s insightful, it can slow down the backtesting process.

9. Start the Test: Once all parameters are set, click the “Start” button. Watch as the strategy tester mt4 backtesting tool simulates your EA over the historical data, offering insights into its potential efficacy.

Key Metrics Provided by MT4’s Strategy Tester

Here’s a closer look at these essential metrics:

  1. Total Net Profit: One of the primary indicators of a strategy’s success, this metric provides the overall profit or loss after all trades. It is the combined result of both gross profit and gross loss, giving traders a holistic view of their strategy’s effectiveness.
  2. Maximal Drawdown: A crucial metric for assessing risk, the maximal drawdown indicates the largest drop in portfolio value before a new peak is achieved. Through the strategy tester , traders can identify if their strategy may lead to unacceptable losses before returning to profitability.
  3. Profit Factor: This is the ratio of gross profit to gross loss. A profit factor greater than one indicates a profitable strategy, while anything less signifies a losing one. By using the strategy tester MT4 backtesting tool, one can determine the robustness of their trading approach quickly.
  4. Expected Payoff: A measure of the average profitability per trade, this metric can give insights into the potential profitability of a strategy in the long run. It’s a vital stat that strategy tester MT4 backtesting meticulously provides.
  5. Total Trades: Representing the overall number of trades executed during the backtesting period, this metric can help traders understand the frequency of trades and the strategy’s activity level.
  6. Largest Profit and Loss Trades: Highlighting the trades that gave the maximum profits and losses, this metric provides insights into potential outliers. By utilizing the strategy tester MT4 backtesting, traders can ascertain if their strategy occasionally takes on undue risks.
  7. Modeling Quality: This percentage indicates the accuracy of the backtesting based on the available historical data. The higher the percentage achieved via the strategy tester , the more reliable the backtest results are likely to be.
  8. Relative Drawdown: Expressed in percentage terms, it signifies the maximum drop in equity relative to the balance. This metric, accessible through the strategy tester MT4 backtesting, allows traders to gauge the relative risk of their strategy.
  9. Miscalculation of Orders: A more technical metric, it indicates if there were any problems executing the orders during the backtest. A high number here would raise red flags about potential technical issues in the strategy’s logic.

Benefits of Using the Strategy Tester on MT4

1. Historical Analysis and Evaluation

At the heart of the strategy tester mt4 backtesting tool is its ability to analyze historical price data. Traders can simulate their trading strategies against years of past market data, thus providing a comprehensive understanding of how a strategy would have fared under different market conditions.

2. Refinement of Trading Strategies

Not all strategies are created equal, and some may require tweaks to be truly effective. The strategy tester mt4 backtesting allows traders to make necessary modifications and refinements. By backtesting iteratively, traders can hone their strategies to perfection, ensuring they’re primed for real-world trading scenarios.

3. Boosting Trader Confidence

There’s an undeniable psychological benefit to using the strategy tester mt4 backtesting tool. When a trader knows that their strategy has been tested rigorously against past data, it instills a sense of confidence. This confidence can be pivotal in making decisive and timely trading decisions.

4. Time and Cost Efficiency

Imagine diving headfirst into the markets with an untested strategy, only to face losses. The strategy tester mt4 backtesting tool can save traders both time and money by identifying potential flaws in a strategy before it’s deployed in a live environment. This preemptive analysis can be the difference between profit and loss.

5. Expert Advisor (EA) Optimization

One of the standout features of MT4 is its ability to use EAs, which are automated trading scripts. With the strategy tester mt4 backtesting tool, traders can optimize these EAs. This involves fine-tuning the parameters of the EA to ensure it operates with maximum efficiency and profitability.

6. Versatility Across Different Market Conditions

The forex market is known for its volatility, with market conditions shifting rapidly. By using the strategy tester mt4 backtesting, traders can simulate their strategies across various market conditions—be it bullish, bearish, or sideways. This versatility ensures that traders are prepared for all possible market scenarios.

7. Risk Management Analysis

Any seasoned trader will emphasize the importance of risk management. With the strategy tester mt4 backtesting tool, traders can gauge potential drawdowns, evaluate risk-reward ratios, and set optimal stop-loss and take-profit points. By understanding potential risks in advance, traders can craft strategies that safeguard their capital.

8. Easy Visualization of Performance

Visual learners will appreciate the graphical outputs provided by the strategy tester mt4 backtesting. It offers charts and graphs that depict a strategy’s performance over time, making it easier to interpret results and understand trading patterns.

Potential Pitfalls of Backtesting on MT4

The trading community largely embraces the strategy tester MT4 backtesting tool for its invaluable insights into past market behavior. However, just like any tool in the realm of trading and investment, it’s not devoid of pitfalls. As the saying goes, understanding the limitations of one’s tools is paramount for efficient use. Let’s delve deep into some of these potential pitfalls associated with the strategy tester MT4 backtesting.

1. Over-reliance on Historical Data: The fundamental premise of the strategy tester MT4 backtesting tool is its reliance on historical data. While this data is crucial for backtesting, relying on it as a sole predictor for future market performance can be misleading. As many financial disclaimers highlight, past performance isn’t necessarily indicative of future results.

2. Curve-fitting: One of the most common issues users face when using the strategy tester MT4 backtesting tool is the danger of curve-fitting. It refers to a situation where a strategy is overly tailored or optimized to perform exceptionally well on past data. The result? A seemingly ‘perfect’ strategy that falters under real-time trading conditions.

3. Data Quality and Completeness: While MT4 is revered for its comprehensive tools, the historical data it provides can sometimes be punctuated with gaps or inaccuracies. These missing chunks or errors can influence the outcomes generated by the strategy tester MT4 backtesting tool, often portraying a skewed picture of a strategy’s viability.

4. Market Condition Variability: The financial markets are influenced by a myriad of factors – from geopolitical events to technological advancements. The strategy tester MT4 backtesting tool tests strategies based on past data and might not always account for unique, unprecedented future market events.

5. Psychological Factors: Backtesting in the comfort of a simulated environment lacks the emotional challenges posed by real-time trading. While the strategy tester MT4 backtesting provides numerical results, it doesn’t replicate the psychological pressure traders might face when actual money is at stake.

6. Slippage and Latency: The strategy tester MT4 backtesting might not always account for real-world trading challenges like slippage (difference between expected price and executed price) and latency (delays in order execution). These factors can significantly influence the profitability of a strategy in live trading conditions.

7. Technological Limitations: Although the strategy tester MT4 backtesting is robust, it might not account for technological disruptions, system failures, or connectivity issues that can affect trades in the real world. These can dramatically alter the success rate of a strategy.

8. Over-optimization: The allure of refining a strategy to perfection using the strategy tester MT4 backtesting can lead to over-optimization. This refers to the process of adjusting a strategy to an extent where it becomes too complex and finely-tuned to past data, reducing its efficacy in future trades.

MT4’s Strategy Tester vs. Real Market Conditions

  • Latency and Execution SpeedOne of the primary differences between strategy tester mt4 backtesting and real market conditions is the element of latency. In the real market, the execution of orders involves a certain delay, commonly known as latency. This delay can be influenced by various factors, including internet connectivity, broker infrastructure, and market volatility. In contrast, when using the strategy tester, orders are executed instantaneously based on historical data.

    Slippage

    Slippage, the difference between the expected price of a trade and the actual executed price, is another critical factor to consider. In the strategy tester mt4 backtesting environment, slippage is often minimal or non-existent, as trades are executed at the exact price levels specified. However, in real market conditions, especially during volatile periods, slippage is a common occurrence. Traders may experience orders being executed at prices slightly different from their intended levels, potentially impacting the overall performance of a trading strategy.

    Market Liquidity

    Market liquidity, or the ease with which an asset can be bought or sold without significantly affecting its price, is a crucial factor in trading. During periods of high volatility or low liquidity, market conditions can change rapidly. In the strategy tester mt4 backtesting tool, historical data may not fully capture the nuances of liquidity fluctuations. Traders need to be prepared for scenarios in real markets where executing large orders can lead to price slippage and adverse effects on strategy performance.

    Emotional and Psychological Factors

    The strategy tester mt4 backtesting tool is a purely analytical environment where emotions and psychological factors do not come into play. Traders can execute trades objectively based on predefined rules. However, in real market conditions, emotions such as fear and greed can influence decision-making. Traders may deviate from their tested strategies due to human factors, which can lead to different outcomes compared to backtesting results.

    Adaptation to Changing Market Conditions

    Another significant consideration is the adaptability of trading strategies to changing market conditions. While the strategy tester mt4 backtesting tool provides valuable insights based on historical data, it cannot predict how a strategy will perform in evolving markets. Traders must continuously monitor and adjust their strategies to align with current market dynamics.

    Bridging the Gap:

    While there are notable differences between strategy tester mt4 backtesting and real market conditions, traders can take several steps to bridge the gap effectively:

    1. Incorporate Realistic Variables: When conducting backtests, consider introducing variables that mimic real market conditions, such as slippage and order execution delays, into the testing parameters.
    2. Forward Testing: After conducting initial backtests, perform forward testing in live or demo trading environments to validate the strategy’s performance under real market conditions.
    3. Risk Management: Implement robust risk management practices to mitigate the impact of unexpected market events or slippage on trading performance.
    4. Continuous Monitoring: Regularly monitor and adapt trading strategies to align with changing market conditions, ensuring they remain relevant and effective.
    5. Emotional Discipline: Practice emotional discipline and stick to predefined trading rules, even in the face of market fluctuations. Emotion-driven decisions can lead to deviations from tested strategies.

Tips to Ensure Effective Backtesting on MT4

  1. Quality of Historical Data Matters:The backbone of any backtest is the historical data it relies on. For the strategy tester mt4 backtesting tool, sourcing high-quality, accurate, and comprehensive historical data is paramount. MT4 does provide a good range of historical data, but consider seeking out specialized databases for the most granular and accurate information.
  2. Avoid Over-optimization:One common pitfall traders fall into when using the strategy tester mt4 backtesting tool is over-optimization. It’s tempting to keep tweaking the strategy until it fits the historical data perfectly. However, remember that over-optimized strategies often perform poorly in real-time trading since they’re tailored too closely to past events.
  3. Use Realistic Market Conditions:It’s essential to ensure that the backtesting environment in the strategy tester mt4 backtesting tool mirrors real market conditions as closely as possible. Account for factors like slippage, spreads, and commissions, which can significantly affect trading outcomes.
  4. Test Across Different Time Frames and Market Conditions:The forex market is dynamic, with conditions changing from day to day. To get a holistic view of a strategy’s robustness using strategy tester mt4 backtesting, test it across multiple timeframes and various market conditions – from calm markets to highly volatile periods.
  5. Stay Updated:The strategy tester mt4 backtesting tool undergoes updates and refinements. Always ensure that your MT4 platform and the strategy tester feature are updated to the latest version. This guarantees not just better performance but also access to new features and improvements.
  6. Integrate Custom Indicators:MT4 allows the addition of custom indicators. If you have specific indicators you rely on for your trading decisions, integrate them within the strategy tester mt4 backtesting tool. This will give you a more accurate representation of how your strategy performs with those indicators in play.
  7. Analyze Results Thoroughly:Once a backtest is complete using the strategy tester mt4 backtesting, don’t just glance at the profit and loss numbers. Delve deep into the results. Examine the drawdown, the win-to-loss ratio, consecutive losses, and other metrics. This comprehensive analysis can provide invaluable insights into the strengths and weaknesses of your strategy.
  8. Combine Backtesting with Forward Testing:While strategy tester mt4 backtesting offers insights based on past data, complement this with forward testing or paper trading in real-time conditions without using real money. This dual approach can give you a comprehensive understanding of how the strategy will likely perform.

Conclusion

The strategy tester mt4 backtesting tool isn’t just another feature of MT4; it’s a necessity for any trader serious about their craft. It’s the unsung hero, operating behind the scenes, ensuring that when traders step into the arena, they are armed with strategies that have weathered the storms of past data.

Strategy Tester TradingView: Unlocking the Power of Backtesting

Strategy Tester TradingView

Introduction

In the vast landscape of trading tools and platforms, TradingView stands out as a beacon for both novice and experienced traders. Offering a myriad of charting tools, technical analyses, and a supportive community, it remains unparalleled. Among its most potent features is the strategy tester  tradingview tool, a gateway for traders to validate their trading strategies before taking the plunge into real-world trading.

Features of the Strategy Tester on TradingView

The landscape of trading is riddled with uncertainty. For traders, both novice and seasoned, having the right tools is paramount to navigate the market’s treacherous waters. One such indispensable tool, especially for those keen on testing their trading strategies, is the strategy tester tradingview offers. Let’s delve deeper into the features of this remarkable tool.

  1. User-Friendly Interface: One of the hallmarks of the strategy tester on tradingview offers is its intuitive interface. New users won’t be daunted, and seasoned traders will appreciate its streamlined design that allows for swift strategy inputs and modifications.
  2. Broad Asset Coverage: Whether you’re a forex enthusiast, a commodities believer, or a stock market stalwart, the strategy tester on tradingview features support a plethora of assets. This universality ensures that traders can test their strategies across multiple markets.
  3. Multiple Timeframes: Timeframes matter in trading. The strategy tester tradingview tool accommodates this by allowing backtesting on various timeframes, from one-minute charts to monthly outlooks. This flexibility ensures that both short-term traders and long-term investors find value in the tool.
  4. In-depth Performance Metrics: The strategy tester on tradingview platform provides isn’t just about visual outputs. It dives deep into metrics, offering insights into total net profit, maximum drawdowns, the Sharpe ratio, and many more. This comprehensive data is invaluable for traders aiming to understand not just the potential upside but also the associated risks.
  5. Visualization Tools: For many traders, a visual representation is more intuitive. The strategy tester on tradingview tool offers excellent visualization features. Users can overlay the strategy’s hypothetical trades on price charts, providing a clear picture of where entries and exits would have been. Profit and loss graphs further add to the visualization suite, giving traders a vivid depiction of strategy performance over time.
  6. Customizable Input Parameters: Every trader has a unique approach. Recognizing this, the strategy tester tradingview platform comes with customizable input parameters. Traders can define specifics, from entry and exit criteria to stop-loss levels and take-profit targets, ensuring that the backtest truly represents their trading methodology.
  7. Historical Data Accuracy: Backtesting is only as good as the data it uses. The strategy tester tradingview boasts taps into TradingView’s extensive database of accurate historical price data, ensuring that the tests are both relevant and reliable.
  8. Overlay Mode: One of the standout features of the strategy tester on tradingview offers is its overlay mode. This allows traders to overlay the strategy’s performance directly on the main price chart, ensuring that they can see the strategy’s hypothetical trades in the context of actual price movements.
  9. Pine Script Integration: For those who have ventured into creating custom indicators and strategies using TradingView’s Pine Script, the strategy tester tradingview tool seamlessly integrates, allowing traders to backtest their custom scripts efficiently.
  10. Realistic Simulations: The strategy tester tradingview provides accounts for real-world factors like slippage and commission. By doing so, it ensures that the backtesting results mirror real-world trading scenarios closely, providing a realistic view of potential performance.

How the Strategy Tester Works

  1. Defining the Trading Strategy
    • Setting Parameters: The first step involves setting up the parameters for your strategy. The strategy tester on tradingview tool offers a range of variables like indicators, price patterns, and timeframes that help in tailoring a strategy according to individual preferences and trading styles.
    • Scripting the Strategy: Advanced users have the option to script their strategies using Pine Script. This programming language, which is native to TradingView, allows for a high degree of customization and precision in defining the strategies to be tested in the strategy tester tradingview tool.
  2. Selection of Timeframes
    • Diversity of Timeframes: The strategy tester on tradingview tool supports a wide array of timeframes, ranging from one minute to one month. This flexibility is critical in testing the effectiveness of a strategy in different market conditions and periods.
    • Multi-Timeframe Analysis: A notable feature of the strategy tester tradingview tool is the ability to analyze multiple timeframes concurrently. This helps in understanding how a strategy performs across various timeframes, providing a holistic view of its potential success.
  3. Utilizing Historical Data
    • Depth of Historical Data: The success of any backtesting process lies in the quality of historical data used. The strategy tester on tradingview tool grants access to an extensive database of historical data across various markets, ensuring that the backtesting process is grounded in reality and offering a reliable insight into the strategy’s potential performance.
    • Analysis of Historical Data: Once a strategy is set, the strategy tester tradingview tool simulates trades based on historical data, offering a detailed analysis of how the strategy would have performed in past market conditions. This helps in fine-tuning the strategy before applying it in real-time trading.
  4. Analyzing the Results
    • Performance Metrics: After the backtesting process, the strategy tester on tradingview tool presents a detailed report encompassing various performance metrics like total net profit, drawdown, and the profit factor. These metrics are crucial in assessing the viability of a strategy.
    • Visualization Tools: To complement the numerical data, the strategy tester tradingview tool offers visualization tools that help in mapping the strategy’s performance graphically. This includes profit and loss graphs and overlays on price charts, facilitating a comprehensive analysis of the strategy’s potential and areas of improvement.
  5. Refinement and Optimization
    • Strategy Optimization: Post-analysis, traders have the opportunity to refine their strategies based on the insights gained. The strategy tester tradingview tool allows for an iterative process where traders can continually optimize their strategies to align with changing market conditions and dynamics.
    • Avoiding Overfitting: A crucial aspect to remember while using the strategy tester tradingview tool is to avoid overfitting. It is essential to strike a balance between optimization and realism to ensure that the strategy remains viable in real-time trading.

Advantages of Using TradingView’s Strategy Tester

  1. In-depth Analysis with Accurate Results: One of the significant benefits of the strategy tester on tradingview tool is the depth of its analysis. Instead of just getting a surface-level insight into a strategy’s potential profitability, users receive a comprehensive breakdown. This includes potential profits, risks, drawdowns, and various other key performance metrics. The accuracy of these results allows traders to make more informed decisions.
  2. Versatility Across Market Instruments: Whether you’re analyzing forex pairs, stocks, commodities, or even cryptocurrencies, the strategy tester tradingview tool caters to a broad spectrum of financial instruments. This versatility means that traders aren’t restricted and can backtest strategies across multiple market scenarios.
  3. Intuitive Visualization Tools: Visual representation often trumps raw data in understanding complex trading outcomes. The strategy tester on tradingview provides a range of visualization tools, from profit and loss graphs to overlays on price charts. This graphical representation aids traders in spotting patterns, potential pitfalls, and opportunities within their strategy.
  4. Seamless Integration with TradingView Charts: What sets the strategy tester on tradingview tool apart is its perfect integration with TradingView’s primary charting tools. Traders can directly apply strategies from charts, test them, tweak them, and re-test in real-time, making the process of strategy refinement fluid and straightforward.
  5. Flexibility in Timeframes: Different traders have different strategies. Some might be looking at intraday movements, while others might be analyzing monthly trends. The strategy tester tradingview tool allows for backtesting across diverse timeframes, making it suitable for all trading styles.
  6. Real-world Simulation: The strategy tester tradingview is not just about hypothetical scenarios. It takes into account real-world factors like commissions, slippages, and other trading costs. This ensures that the backtested results are as close to real-world outcomes as possible.
  7. Ease of Use: Despite its advanced features, the strategy tester tradingview tool boasts an intuitive interface. This makes it accessible even to those new to trading, ensuring that everyone can benefit from its capabilities.
  8. Continuous Upgrades and Support: TradingView is known for its continuous enhancements and user-focused upgrades. The strategy tester tradingview tool benefits from this approach, with regular updates ensuring it remains at the forefront of backtesting tools.

Common Mistakes to Avoid When Using Strategy Tester

  1. Overfitting the Data
    • Mistake: One of the most prevalent mistakes using the strategy tester on tradingview tool is overfitting. Traders might continually adjust their strategy until it fits past data perfectly.
    • Solution: Remember, the goal isn’t to fit historical data perfectly but to create a strategy that is robust across various market conditions. Always question the practicality of the strategy in real-world trading.
  2. Ignoring Commissions and Slippage
    • Mistake: Forgetting to account for trading costs is a common oversight. A strategy that looks profitable in the strategy tester on tradingview tool might be a loss-maker in the real world after accounting for commissions and slippage.
    • Solution: Always include estimated trading costs in your backtesting parameters. This will give a more realistic representation of potential profitability.
  3. Over-relying on Past Performance
    • Mistake: Some traders believe that just because a strategy performed well in the past, it’s a guaranteed winner for the future.
    • Solution: Always remember the adage: Past performance is not indicative of future results. While the strategy tester tradingview tool is invaluable, it’s just one of many tools in a trader’s arsenal.
  4. Using Insufficient Data
    • Mistake: Backtesting a strategy on a short timeframe or limited data might give skewed results. A strategy might perform well during a bullish phase but fail during a bearish period.
    • Solution: Ensure you use a comprehensive dataset when using the strategy tester tradingview tool. This includes varying market conditions to test the strategy’s resilience.
  5. Not Accounting for Outliers
    • Mistake: Some traders overlook significant market events, such as crashes or spikes. While these might be rare, they can profoundly impact a strategy’s viability.
    • Solution: When reviewing results from the strategy tester tradingview tool, always consider significant market events and how they affected your strategy’s performance.
  6. Failing to Re-test Periodically
    • Mistake: Believing that once a strategy is backtested, it’s set in stone for life.
    • Solution: Markets evolve, and so should your strategies. Periodically use the strategy tester tradingview tool to re-test and tweak your strategies to ensure they remain relevant.
  7. Ignoring the Psychological Aspect
    • Mistake: Relying solely on numbers and forgetting the human element of trading.
    • Solution: Even if the strategy tester on tradingview tool suggests your strategy is sound, ask yourself if you can execute it. Can you handle potential drawdowns mentally and emotionally?

Comparing TradingView’s Strategy Tester to Other Backtesting Tools

1. User Interface and Usability

Most backtesting tools come with a steep learning curve, demanding considerable time and patience from traders. The strategy tester tradingview tool, on the other hand, offers an intuitive user interface. Its clean design and easy-to-understand metrics make it approachable for both newcomers and experienced traders. While other platforms might require extensive coding or setup, the strategy tester tradingview tool simplifies the process, making strategy testing more accessible.

2. Depth of Historical Data

Access to extensive and accurate historical data is crucial for backtesting. The strategy tester on  tradingview tool shines here. TradingView boasts a vast repository of historical price data across numerous asset classes. While other tools might offer limited data or charge extra for extended data sets, the strategy tester tradingview ensures comprehensive data access, enhancing the accuracy of backtests.

3. Versatility and Flexibility

Backtesting tools need to accommodate various trading styles, from scalping to long-term investing. The strategy tester tradingview tool offers a versatile testing environment. Whether a user is interested in forex, stocks, cryptocurrencies, or commodities, the tool has it covered. Many competing platforms are niche-specific, limiting their usability across diverse markets.

4. Visualization and Reporting

A standout feature of the strategy tester tradingview tool is its visualization capabilities. Traders can overlay backtest results on price charts, view profit and loss graphs, and get a clear visual representation of trade outcomes. Other tools might provide numerical outputs, but the visual feedback from strategy tester tradingview is invaluable for understanding strategy performance in context.

5. Cost Efficiency

While some might argue that there are free backtesting tools available, the strategy tester tradingview tool offers a balance between cost and functionality. Some free platforms lack the depth and features that TradingView provides, and more expensive platforms might not offer additional benefits commensurate with their higher price tags. With the strategy tester tradingview tool, traders get a comprehensive backtesting solution without breaking the bank.

6. Integration with a Larger Ecosystem

What sets the strategy tester tradingview tool apart is its seamless integration within the larger TradingView ecosystem. Traders can switch from backtesting to real-time chart analysis, leverage community insights, and even execute trades with certain brokers. Few platforms offer such a cohesive trading environment.

7. Customizability

Many backtesting platforms come with rigid, predefined parameters. In contrast, the strategy tester tradingview tool offers traders the ability to customize tests deeply. This customizability, from defining specific input parameters to scripting unique scenarios, is a boon for traders looking to test unconventional strategies.

Tips for Getting the Most Out of the Strategy Tester

  1. Understand Your Strategy Fundamentals: Before delving into the strategy tester tradingview tool, have a clear understanding of your trading strategy’s core principles. Knowing your entry and exit triggers, as well as any indicators you rely on, will allow you to set the tester’s parameters accurately.
  2. Ensure Data Accuracy and Relevance: The strategy tester on tradingview tool pulls from a vast reservoir of historical data. Ensure that the data you’re using for backtesting is relevant to your trading strategy’s time frame and market.
  3. Avoid Overfitting: One common mistake traders make with the strategy tester tradingview tool is over-optimizing their strategy to fit past data perfectly. This can create a strategy that’s too specific and fails in real-world application. Remember to create a balance between adaptability and specificity.
  4. Factor in Trading Costs: For a more realistic assessment, always account for potential trading costs, such as slippage and commissions, when backtesting on the strategy tester tradingview platform.
  5. Periodic Reviews and Adjustments: The market is dynamic, and what works today may not be as effective tomorrow. Periodically use the strategy tester on tradingview tool to revisit and adjust your strategies in line with prevailing market conditions.
  6. Combine Multiple Tools and Indicators: TradingView offers a suite of analytical tools and indicators. For a holistic strategy evaluation, consider using multiple tools in tandem with the strategy tester on tradingview feature. This way, you’re not relying solely on backtest results but also on other forms of technical analysis.
  7. Run Multiple Time Frame Tests: If your strategy is flexible across different time frames, utilize the strategy tester on tradingview tool to test it on various timeframes. This can provide a broader perspective on its efficacy.
  8. Be Critical of Results: A strategy that yields stellar results in the strategy tester tradingview tool might still need scrutiny. Always approach results critically, asking what might have contributed to specific outcomes and if they’re replicable in real-time trading.
  9. Stay Updated: TradingView regularly updates its features, ensuring users have the best tools at their disposal. Keep an eye on updates related to the strategy tester on tradingview tool and familiarize yourself with any new functionalities or improvements.
  10. Engage with the Community: TradingView has a vibrant community of traders and analysts. Engage with peers, share insights, and gather feedback on your strategies. Collective wisdom can offer valuable insights that you might overlook when using the strategy tester on tradingview tool alone.

Conclusion

The strategy tester tradingview tool is a gem for traders. In a realm where strategy and analysis reign supreme, having a tool that lets you test your hypotheses is invaluable. It’s a blend of science and art, letting traders tread confidently in the world of trading.

Stochastic Oscillator Scalping Strategy: Precision in Short-Term Trades

Stochastic Oscillator Scalping Strategy

Introduction to Stochastic Oscillator Scalping Strategy

Before we dive into the intricacies of scalping with the Stochastic Oscillator, let’s start with a brief introduction to both concepts.

Scalping is a trading strategy that focuses on capturing small price movements in the market. Scalpers aim to profit from tiny fluctuations in asset prices by executing a large number of trades within a short timeframe. This strategy requires precision, quick decision-making, and the ability to react swiftly to changing market conditions.

The Stochastic Oscillator, on the other hand, is a technical indicator that measures the momentum of an asset’s price. It consists of two lines, %K and %D, which oscillate between 0 and 100. The Stochastic Oscillator is a valuable tool for identifying potential trend reversals and overbought or oversold conditions.

Understanding Scalping in Trading

Scalping is all about taking advantage of small price movements. Scalpers don’t hold positions for extended periods; instead, they seek to profit from short-lived market fluctuations. This approach is ideal for traders who thrive in high-pressure, rapid decision-making scenarios.

The primary objectives of scalping include:

  • Capitalizing on Intraday Volatility: Scalpers aim to profit from the price volatility that occurs during a single trading session.
  • Accumulating Small Gains: By making numerous small gains, scalpers can accumulate profits over time.

The Stochastic Oscillator: A Quick Recap

Before we proceed further, let’s revisit the Stochastic Oscillator and its relevance to scalping. The Stochastic Oscillator consists of two lines:

  • %K Line: This line represents the current closing price in relation to the price range over a specified period, typically 14 periods. It oscillates between 0 and 100.
  • %D Line: %D is a smoothed version of %K, usually a 3-period simple moving average of %K.

The Stochastic Oscillator helps traders identify potential reversals and overbought/oversold conditions. Readings above 80 suggest overbought conditions, while readings below 20 indicate oversold conditions.

Benefits of Scalping with the Stochastic Oscillator

1. Quick Decision-Making:

Scalping with the Stochastic Oscillator demands swift decision-making. Scalpers enter and exit trades within minutes, sometimes seconds. The Stochastic Oscillator, with its ability to generate signals rapidly, aligns perfectly with this need for speed. Traders can rely on the indicator to provide timely buy and sell signals, allowing them to execute trades without hesitation. This quick decision-making is crucial in capturing small price movements that define scalping success.

2. Precision Entries and Exits:

In scalping, every pip or tick matters. Traders aim to profit from the tiniest price fluctuations, and precision is paramount. The Stochastic Oscillator excels in this regard by helping traders identify optimal entry and exit points. When the %K and %D lines cross or when the indicator signals overbought or oversold conditions, scalpers receive clear indications of potential price reversals. This precision minimizes guesswork and enhances the accuracy of trades.

3. Versatility Across Markets:

Scalping with the Stochastic Oscillator isn’t limited to a specific market or asset class. Whether you’re trading forex, stocks, cryptocurrencies, or commodities, this strategy can be adapted to suit different markets. Scalpers can apply the same principles and techniques with the Stochastic Oscillator to various financial instruments. This versatility allows traders to explore multiple markets and capitalize on opportunities as they arise.

4. Scalping Multiple Timeframes:

The Stochastic Oscillator can be used across different timeframes, making it suitable for scalping on various scales. Scalpers can apply this strategy on shorter timeframes, such as the 1-minute or 5-minute charts, for rapid trades. Alternatively, they can scale up to slightly longer timeframes, like the 15-minute chart, for slightly longer-duration scalping. This flexibility enables traders to align their scalping approach with their preferred timeframe and trading goals.

5. Minimized Exposure to Market Risk:

Scalping with the Stochastic Oscillator often results in shorter holding periods for trades. Unlike swing or position trading, where trades can be held for days or weeks, scalpers typically close their positions within minutes. This reduced exposure to the market helps mitigate the risk associated with overnight price fluctuations, news events, or other unexpected market developments. Traders can enter and exit the market swiftly, reducing the time during which their capital is at risk.

6. Frequency of Trading Opportunities:

Scalping, by its nature, involves a high frequency of trades. Scalpers may execute numerous trades within a single trading session. This high level of activity can translate into a greater number of trading opportunities. The Stochastic Oscillator assists in identifying these opportunities by generating signals frequently. As a result, scalpers can capitalize on multiple small movements in asset prices throughout the day.

7. Adaptable to Diverse Trading Styles:

Scalping with the Stochastic Oscillator accommodates traders with various trading styles. Whether you prefer trend-following strategies, mean-reversion approaches, or momentum-based tactics, the Stochastic Oscillator can be integrated into your scalping methodology. By adjusting the parameters and fine-tuning your strategy, you can tailor it to align with your preferred trading style and risk tolerance.

8. Potential for Compounding Gains:

While each individual scalped trade may yield a modest profit, the cumulative effect of multiple successful scalping trades can result in significant gains over time. Scalpers have the opportunity to compound their profits by reinvesting their earnings into subsequent trades. The rapid turnover of capital in scalping allows traders to maximize the potential for compounding gains, steadily growing their trading accounts.

Setting Up the Stochastic Oscillator for Scalping

Selecting the Right Trading Platform

Before diving into the setup process, it’s crucial to ensure you’re using a reputable trading platform that supports the Stochastic Oscillator indicator. MetaTrader 4 (MT4) and MetaTrader 5 (MT5) are two popular choices among traders for their robust technical analysis tools, including the Stochastic Oscillator. Ensure you have access to one of these platforms to follow the steps outlined below.

Accessing the Indicator

Once you’ve logged into your chosen trading platform and selected the asset you want to scalp, it’s time to access the Stochastic Oscillator indicator. Here’s a step-by-step guide using MetaTrader 4 as an example:

  1. Open a Chart: Navigate to the chart of the asset you wish to trade. This can usually be done by clicking on the asset’s symbol in the platform’s market watchlist or by searching for it in the platform’s search function.
  2. Insert Indicator: In MT4, you can insert indicators by clicking on the “Insert” menu at the top of the platform. A drop-down menu will appear.
  3. Select Oscillators: From the drop-down menu, hover your cursor over “Indicators,” and another submenu will appear. Choose “Oscillators” from this submenu.
  4. Choose Stochastic Oscillator: In the “Oscillators” submenu, you’ll find the “Stochastic Oscillator” option. Click on it to add the indicator to your chart.

Configuring the Stochastic Oscillator for Scalping

Now that you’ve added the Stochastic Oscillator to your chart, it’s time to configure it to suit your scalping strategy. The Stochastic Oscillator has several parameters that you can adjust, including:

  1. %K Period: This represents the number of periods used for the calculation of the %K line. For scalping, shorter periods, such as 5 or 7, are often preferred to capture rapid price movements.
  2. %D Period: The %D line is a smoothed version of the %K line, typically represented as a 3-period simple moving average of %K.
  3. Slowing: Slowing is an additional smoothing parameter applied to %K. A common value for slowing is 3.
  4. Overbought and Oversold Levels: These are typically set at 80 for overbought and 20 for oversold, but you can adjust them based on your strategy and the asset you’re trading.
  5. Colors and Style: You can also customize the appearance of the Stochastic Oscillator on your chart by choosing different colors and line styles.

Optimizing Stochastic Oscillator Parameters

The choice of parameters for the Stochastic Oscillator is crucial for scalping success. Keep in mind that there is no one-size-fits-all approach, and the optimal settings may vary depending on your trading style and the market you’re trading.

  • Shorter %K and %D Periods: For scalping, shorter periods (e.g., 5 for %K and 3 for %D) are often preferred to capture rapid price movements and generate quick signals.
  • Slowing: Slowing is used to smooth the %K line. A lower slowing value (e.g., 3) may be suitable for scalpers aiming for rapid signals.
  • Experiment and Backtest: It’s essential to experiment with different parameter settings and backtest your strategy using historical data to find the settings that work best for your scalping approach.

Saving and Using Templates

Once you’ve configured the Stochastic Oscillator to your preferred settings, you can save it as a template on your trading platform. This allows you to apply the same settings to multiple charts quickly. In MetaTrader, you can save your chart template by right-clicking on the chart, selecting “Template,” and then choosing “Save Template.”

By saving your preferred Stochastic Oscillator settings as a template, you can streamline the setup process and focus on executing your scalping strategy with precision.

Scalping Signals with the Stochastic Oscillator

Now, let’s delve into the heart of scalping with the Stochastic Oscillator: generating buy and sell signals. Here’s how scalpers use this indicator:

1. Overbought and Oversold Conditions:

  • Overbought: When the Stochastic Oscillator’s %K and %D lines rise above 80, it suggests that the asset may be overbought. This could be an opportunity to consider a short (sell) trade.
  • Oversold: Conversely, when %K and %D fall below 20, it indicates oversold conditions. This may be a signal to consider a long (buy) trade.

2. %K and %D Crossovers:

  • Bullish Crossover: When the %K line crosses above the %D line, it generates a bullish signal. Scalpers may consider a long trade.
  • Bearish Crossover: When the %K line crosses below the %D line, it generates a bearish signal. Scalpers may consider a short trade.

Scalping Strategies with the Stochastic Oscillator

Now that we’ve covered the basics, let’s explore some popular scalping strategies that incorporate the Stochastic Oscillator. Each strategy offers a unique approach to scalping and can be adapted to suit your trading style.

1. Stochastic Overbought/Oversold Strategy:

  • Objective: To capitalize on overbought and oversold conditions identified by the Stochastic Oscillator.
  • Execution: Enter long positions when the Stochastic Oscillator falls below 20 and exit when it rises above 80. For short positions, enter when the indicator rises above 80 and exit when it falls below 20.

2. Stochastic Crossover Strategy:

  • Objective: To identify trend reversals using %K and %D crossovers.
  • Execution: Enter long positions when %K crosses above %D and exit when %K crosses below %D. For short positions, enter when %K crosses below %D and exit when %K crosses above %D.

3. Stochastic Double-Cross Strategy:

  • Objective: To refine entry and exit points by using two Stochastic Oscillators with different settings.
  • Execution: Use two Stochastic Oscillators, one with fast settings (e.g., 5,3) and one with slower settings (e.g., 14,7). Look for crossovers on both oscillators for stronger signals.

4. Scalping Divergence with Stochastic:

  • Objective: To identify divergence between price and the Stochastic Oscillator, signaling potential reversals.
  • Execution: Look for situations where price forms higher highs (or lower lows) while the Stochastic Oscillator forms lower highs (or higher lows). This can signal a potential reversal.

Risk Management for Scalpers

Scalping may offer quick gains, but it also comes with increased risk due to the frequency of trades. Here are essential risk management strategies for scalpers:

  • Position Sizing: Determine the size of each position based on your risk tolerance and account size. Avoid risking a significant portion of your capital on a single trade.
  • Stop-Loss and Take-Profit Orders: Always set stop-loss orders to limit potential losses. Similarly, use take-profit orders to secure profits when a trade goes in your favor.
  • Risk-Reward Ratio: Ensure that the potential reward justifies the risk you’re taking. A common guideline is to aim for a risk-reward ratio of at least 1:2.

Psychology of Scalping

Scalping can be mentally demanding due to the rapid decision-making required. Here are some psychological aspects to keep in mind:

  • Discipline: Stick to your scalping strategy and avoid impulsive decisions.
  • Stress Management: Scalping can be intense; manage stress through relaxation techniques and breaks.
  • Emotional Control: Keep emotions like fear and greed in check. Avoid revenge trading after losses.

Common Mistakes in Stochastic Oscillator Scalping

Even experienced scalpers can make mistakes. Here are some common errors to watch out for:

  • Overtrading: Scalpers may be tempted to execute too many trades, leading to exhaustion and poor decision-making.
  • Neglecting Risk Management: Failing to set stop-loss orders or risking too much on a single trade can be disastrous.
  • Chasing Losses: Attempting to recover losses quickly can lead to impulsive and reckless trading.
  • Ignoring Market Conditions: Scalping in highly volatile or illiquid markets can be challenging and risky.

Scalping with the Stochastic Oscillator in Different Markets

Scalping is a versatile strategy that can be applied to various markets, including:

  • Forex: The forex market is a popular choice for scalpers due to its liquidity and round-the-clock availability.
  • Stocks: Scalping stocks can be lucrative, especially during earnings reports and significant news events.
  • Cryptocurrencies: Crypto markets offer ample opportunities for scalping, thanks to their inherent volatility.
  • Commodities: Scalping commodities like oil and gold can be profitable during periods of price volatility.

Each market has its unique characteristics, and scalpers should adapt their strategies accordingly.

Backtesting and Fine-Tuning Scalping Strategies

Backtesting serves multiple purposes in the world of trading, especially for scalpers who operate in the fast lane of the financial markets. Here’s why backtesting is so crucial:

  1. Historical Performance Evaluation: Backtesting allows scalpers to assess how their strategy would have performed in the past. It provides valuable insights into the strategy’s profitability, win rate, and drawdowns.
  2. Risk Assessment: By analyzing historical data, scalpers can identify the maximum drawdowns and potential losses that their strategy might incur. This information is essential for proper risk management.
  3. Strategy Validation: Backtesting helps confirm whether the chosen Stochastic Oscillator scalping strategy is indeed effective and reliable. It separates profitable strategies from those that are merely based on luck.
  4. Parameter Optimization: During backtesting, scalpers can experiment with different parameters (e.g., Stochastic settings) to identify the most optimal configuration for their strategy.
  5. Psychological Preparation: Going through the historical performance of a strategy can mentally prepare scalpers for the ups and downs they may encounter in live trading.

Steps for Backtesting a Stochastic Oscillator Scalping Strategy

Let’s break down the process of backtesting a Stochastic Oscillator scalping strategy into actionable steps:

1. Data Collection: Obtain historical price data for the asset or market you intend to trade. This data should include price open, high, low, and close (OHLC) for each time period (e.g., 1-minute, 5-minute, or 15-minute intervals).

2. Choose a Testing Period: Select a specific period for your backtest. This could be several months or even years, depending on your preferred trading frequency. Ensure that the data covers both trending and ranging market conditions.

3. Define Entry and Exit Rules: Clearly outline the rules that dictate when you should enter and exit trades based on your Stochastic Oscillator scalping strategy. This may include criteria for overbought/oversold conditions, %K/%D crossovers, and other relevant signals.

4. Set Position Sizing and Risk Management Rules: Determine how much capital you’ll allocate to each trade and establish risk management rules, including stop-loss and take-profit levels. Stick to these rules consistently during the backtest.

5. Execute the Backtest: Manually go through the historical data and execute your trades based on the predefined entry and exit rules. Keep track of each trade’s outcome, including profits and losses.

6. Record and Analyze Results: Maintain a detailed log of your backtest results, including key metrics such as:

  • Total number of trades executed.
  • Percentage of winning trades (%Win).
  • Average profit per trade.
  • Maximum drawdown (the largest peak-to-trough decline).
  • Risk-reward ratio.
  • Overall profitability.

7. Identify Areas for Improvement: Review the results to identify areas where your Stochastic Oscillator scalping strategy can be improved. This might involve tweaking entry/exit rules, optimizing parameters, or enhancing risk management.

8. Refine Your Strategy: Based on your analysis, make necessary adjustments to your strategy. These refinements should aim to enhance its profitability, reduce risk, and increase consistency.

9. Repeat the Backtest: After refining your strategy, conduct another round of backtesting to assess its improved performance. Repeat this process iteratively until you’re satisfied with the results.

The Role of Forward Testing

While backtesting provides valuable insights, it’s essential to recognize that historical performance is not a guarantee of future results. Therefore, after thorough backtesting and refinements, it’s advisable to conduct forward testing or paper trading.

Conclusion

Scalping is not for the faint-hearted, but for those who thrive in high-pressure situations, it can be a rewarding trading strategy. When combined with the precision of the Stochastic Oscillator, scalping offers a unique approach to short-term trading. By understanding the nuances of this strategy and adhering to proper risk management, you can enhance your chances of success in the fast-paced world of scalping.

Stochastic Oscillator Strategy: Mastering Market Momentum with Precision

Stochastic Oscillator Strategy

Introduction to Stochastic Oscillator Strategy

Technical indicators form the cornerstone of modern trading. They provide traders with essential insights into market dynamics. Among these, the Stochastic Oscillator stands as a stalwart, aiding traders in spotting potential trend reversals and overbought or oversold conditions.

Understanding the Stochastic Oscillator

At its core, the Stochastic Oscillator is a momentum indicator that compares a particular closing price of an asset to its price range over a set period. This comparison is presented in the form of two lines: %K and %D. These lines oscillate between 0 and 100, offering a visual representation of market momentum. High readings signal overbought conditions, while low readings indicate oversold conditions.

Types of Stochastic Oscillators

As traders delve into the world of technical analysis, the Stochastic Oscillator stands out as a versatile and valuable tool for market analysis. While it’s crucial to understand the core principles of the Stochastic Oscillator, it’s equally important to explore the various types of Stochastic Oscillators available. These different variations can help traders refine their Stochastic Oscillator strategy and adapt to varying market conditions.

1. Fast Stochastic Oscillator

The Fast Stochastic Oscillator is perhaps the most common and widely used version of the Stochastic Oscillator. It is known for its responsiveness to short-term price movements. Here’s what sets it apart:

  • Speed: The Fast Stochastic calculates the %K and %D values over a short look-back period, typically 14 periods. This results in more sensitive and frequent signals.
  • Volatility: Due to its sensitivity, the Fast Stochastic is more prone to fluctuations and can generate signals that respond quickly to market changes.
  • Overbought and Oversold Conditions: It identifies overbought and oversold conditions rapidly, potentially leading to earlier entry and exit points in trades.

The Fast Stochastic is well-suited for traders who prefer shorter timeframes and more agile trading strategies, such as day traders and scalpers.

2. Slow Stochastic Oscillator

In contrast to the Fast Stochastic, the Slow Stochastic Oscillator is designed to provide a smoother and more stable representation of price momentum. Here’s what distinguishes it:

  • Smoothing: The Slow Stochastic adds an additional layer of smoothing to the %K and %D values, often by applying a three-period simple moving average (SMA) to each line.
  • Lag: Due to the added smoothing, the Slow Stochastic is less responsive to short-term price movements. It’s better suited for capturing longer-term trends.
  • Reduced False Signals: The Slow Stochastic is less prone to generating false signals compared to its faster counterpart, making it suitable for swing traders and those who prefer a more relaxed trading approach.

The choice between the Fast and Slow Stochastic Oscillators depends on a trader’s preferred timeframe and trading style. While the Fast Stochastic excels in agility, the Slow Stochastic provides a more stable and reliable signal.

3. Full Stochastic Oscillator

The Full Stochastic Oscillator is an extended version of the Slow Stochastic, offering additional flexibility and customization options. Key features include:

  • Customizable Look-Back Periods: Traders can adjust the look-back periods for both %K and %D, allowing for a broader range of analysis possibilities.
  • Enhanced Precision: The Full Stochastic provides more granular insights into price momentum by allowing traders to fine-tune the indicator’s parameters.
  • Flexibility: It can be applied to various timeframes and markets, making it adaptable to different trading strategies.

The Full Stochastic Oscillator is favored by traders who appreciate a high degree of customization in their analysis. It’s particularly useful for those who want to align the indicator closely with their unique trading goals and preferences.

4. Slow Stochastic with Smoothing (Smoothed Stochastic)

The Smoothed Stochastic, as the name suggests, further emphasizes smoothness in its signals. It achieves this by adding additional smoothing components to the traditional Slow Stochastic. Key characteristics include:

  • Exceptional Smoothness: The Smoothed Stochastic is designed to reduce noise and produce exceptionally smooth %K and %D lines.
  • Minimized False Signals: By reducing abrupt changes in indicator values, the Smoothed Stochastic aims to minimize false signals, making it suitable for traders who prioritize signal reliability.
  • Enhanced Trend Identification: Its smoothed nature is particularly useful for identifying trends, and it’s often employed by trend-following traders.

The choice of Stochastic Oscillator type should align with a trader’s specific trading strategy and risk tolerance. While each type has its merits, understanding their differences is crucial to tailor your Stochastic Oscillator strategy effectively.

Role of Stochastic Oscillator in Trading

Understanding the Stochastic Oscillator

Before we explore its role, let’s briefly recap what the Stochastic Oscillator is. It’s a momentum indicator that measures the speed and change of price movements. This indicator generates two lines, %K and %D, which oscillate between 0 and 100. It’s primarily used to identify overbought and oversold conditions in the market, which are indicative of potential trend reversals.

Spotting Overbought and Oversold Conditions

One of the primary roles of the Stochastic Oscillator strategy is to help traders identify overbought and oversold conditions. These conditions suggest that an asset’s price may have deviated too far from its average and could be due for a reversal. In the context of the Stochastic Oscillator Strategy, this is a critical element.

  • Overbought Condition: When the Stochastic Oscillator rises above the 80 mark, it indicates that the asset is potentially overbought. Traders using the strategy might interpret this as a signal to consider selling, as a correction or reversal could be on the horizon.
  • Oversold Condition: Conversely, when the Stochastic Oscillator drops below the 20 mark, it suggests that the asset is oversold. For traders employing the strategy, this could be seen as an opportunity to consider buying, as the price may be due for a bounce or reversal.

Divergence Analysis

Divergence is another crucial role played by the Stochastic Oscillator. Divergence occurs when the price of an asset moves in the opposite direction of the indicator. This can be a powerful signal for traders using the Stochastic Oscillator Strategy.

  • Regular Divergence: Regular divergence occurs when the price forms a higher high or lower low, while the Stochastic Oscillator does the opposite. For instance, if the price makes a higher high, but the oscillator forms a lower high, it could be a bearish divergence signal, indicating a potential trend reversal to the downside.
  • Hidden Divergence: Hidden divergence, on the other hand, happens when the price and the Stochastic Oscillator move in the same direction, but the oscillator leads the price. For example, if the price forms a lower low, but the oscillator creates a higher low, it could be a bullish hidden divergence, suggesting a potential uptrend continuation.

Confirmation and Timing

The Stochastic Oscillator also serves as a confirmation tool in trading strategies. When used in conjunction with other technical indicators or chart patterns, it can help traders refine their entry and exit points. The Stochastic Oscillator Strategy often incorporates these confirmations to increase the reliability of signals.

By understanding the current momentum and potential reversal points indicated by the Stochastic Oscillator, traders can time their trades more effectively. They may wait for the oscillator to move out of overbought or oversold conditions or look for divergence confirmation before executing their trades.

Setting Up the Stochastic Oscillator

In the realm of trading, strategy is everything. And when it comes to developing a robust Stochastic Oscillator strategy, the first step is setting up this powerful technical indicator correctly. In this section, we’ll dive deep into the process of configuring the Stochastic Oscillator, ensuring it becomes a valuable tool in your trading arsenal.

Selecting the Right Trading Platform

Before you can begin setting up the Stochastic Oscillator, you need access to a reliable trading platform. Most popular trading platforms, such as MetaTrader 4 (MT4) and MetaTrader 5 (MT5), offer built-in support for this indicator. Ensure you have access to a platform that suits your trading needs.

Launching the Indicator

Once you’re logged into your chosen trading platform, the next step is to locate and launch the Stochastic Oscillator indicator. On most platforms, this can be done by:

  1. Opening a Price Chart: Begin by opening a price chart for the asset you intend to trade. This could be a currency pair, a stock, a commodity, or any other financial instrument.
  2. Navigating to Indicators: Look for the “Indicators” or “Studies” menu on your trading platform. Different platforms may use slightly different terminology, but the objective is the same: to access technical indicators.
  3. Locating Stochastic Oscillator: Within the Indicators menu, search for the Stochastic Oscillator. It’s often listed under the “Oscillators” or “Momentum” category.
  4. Applying the Indicator: Once you’ve found the Stochastic Oscillator, apply it to your price chart. This action will typically overlay the indicator on your chart, creating two lines – %K and %D.

Configuring Stochastic Oscillator Parameters

The default settings of the Stochastic Oscillator may not always align with your trading strategy or preferences. Customizing the indicator’s parameters is a crucial step in setting it up effectively. Here are the key parameters you can typically adjust:

  1. %K Period: This parameter determines the number of periods used to calculate the %K line. Common values range from 5 to 14, but you can adjust this based on your trading style and timeframes.
  2. %D Period: The %D line is often referred to as the signal line. It represents a moving average of the %K line. Like %K, the %D period can be customized to suit your preferences.
  3. Smoothing: Some platforms offer the option to apply smoothing to the Stochastic Oscillator. Smoothing can help reduce noise in the indicator’s signals.

Understanding Overbought and Oversold Levels

One of the primary uses of the Stochastic Oscillator in trading is identifying overbought and oversold conditions. By default, these levels are set at 80 (overbought) and 20 (oversold). However, you can adjust these levels based on your risk tolerance and market conditions.

  • Overbought: If you’re trading in a strong uptrend, you may want to adjust the overbought level to a higher value, such as 90 or even 95. This adjustment prevents premature sell signals in robust trends.
  • Oversold: Conversely, in a strong downtrend, you can adjust the oversold level to a lower value, like 10 or 15. This modification can help avoid early buy signals when a downtrend is still intact.

Saving Your Settings

Once you’ve customized the Stochastic Oscillator parameters to your liking, it’s essential to save your settings. Most trading platforms allow you to save indicator configurations, making it convenient to apply the same settings to multiple charts or instruments.

Interpreting Stochastic Oscillator Signals

Trading decisions often hinge on interpreting Stochastic Oscillator signals. Understanding how to spot buy and sell signals using %K and %D crossovers is essential. Additionally, we delve into using overbought and oversold conditions as entry and exit points.

Stochastic Oscillator Trading Strategies

The heart of this guide lies in exploring various trading strategies that leverage the Stochastic Oscillator. Whether you’re a day trader, swing trader, or long-term investor, there’s a strategy that can align with your goals. Real-world examples illustrate how traders utilize Stochastic signals to make informed choices.

Benefits and Limitations of the Stochastic Oscillator

The Stochastic Oscillator Strategy is a powerful tool that can aid traders in navigating the intricate waters of financial markets. However, like any technical indicator, it comes with its own set of benefits and limitations. Understanding these can be instrumental in effectively integrating the Stochastic Oscillator into your trading strategy.

Benefits of Using the Stochastic Oscillator

  1. Spotting Overbought and Oversold Conditions: One of the primary advantages of the Stochastic Oscillator is its ability to identify overbought and oversold conditions in the market. When %K and %D readings reach extreme levels (usually above 80 for overbought and below 20 for oversold), it signals potential price reversals. Traders can use these signals to make informed decisions about entering or exiting trades.
  2. Providing Confirmation Signals: The Stochastic Oscillator can be a valuable confirmation tool when used in conjunction with other technical indicators or trading strategies. For example, if a trader identifies a potential trend reversal using a different method, a Stochastic Oscillator signal that aligns with this view can increase the confidence in the trade.
  3. Divergence Analysis: Divergence occurs when the price of an asset and the Stochastic Oscillator readings move in opposite directions. This can be a powerful signal, indicating a potential change in trend direction. Divergence analysis is a valuable technique that traders can employ with the Stochastic Oscillator.
  4. Versatility in Timeframes: The Stochastic Oscillator can be applied to various timeframes, from short-term day trading to longer-term investing. This versatility makes it suitable for traders with different trading styles and preferences.
  5. Simple Interpretation: Unlike some complex technical indicators, the Stochastic Oscillator provides straightforward signals. Traders can quickly grasp the meaning of overbought, oversold, and crossover signals without extensive technical knowledge.

Limitations of the Stochastic Oscillator

  1. Whipsaws in Choppy Markets: The Stochastic Oscillator can generate false signals, known as “whipsaws,” in choppy or sideways markets. Traders may receive frequent buy and sell signals that do not result in profitable trades during these conditions.
  2. Lagging Indicator: Like many oscillators, the Stochastic Oscillator is a lagging indicator, meaning it relies on past price data to generate signals. This lag can result in missed opportunities or delayed responses to rapidly changing market conditions.
  3. Overbought and Oversold Can Persist: In strong trending markets, assets can remain in overbought or oversold conditions for extended periods. Relying solely on these conditions to trigger trades can lead to missed opportunities or premature exits.
  4. Not Suitable for Trending Markets: The Stochastic Oscillator is primarily designed to identify potential reversals in range-bound markets. It may not perform as well in strongly trending markets where overbought or oversold conditions may persist.
  5. Subject to False Divergence Signals: While divergence analysis can be powerful, it is not foolproof. False divergence signals can occur, leading to incorrect trading decisions.

Risk Management with the Stochastic Oscillator Strategy

Now, let’s explore how the Stochastic Oscillator Strategy can be integrated into your risk management approach:

  1. Setting Stop-Loss Orders: A fundamental aspect of risk management is setting stop-loss orders. These are predetermined price levels at which you’re willing to exit a trade to limit potential losses. When employing the Stochastic Oscillator strategy, consider placing your stop-loss orders based on the signals generated by the indicator. For example, if you’re going long based on a Stochastic oversold signal, you might set your stop-loss just below the entry point.
  2. Take-Profit Levels: In addition to stop-loss orders, take-profit levels are equally important. These are predetermined price levels at which you plan to exit a trade to lock in profits. The Stochastic Oscillator can help you identify potential reversal points. When you’re in a winning trade, consider using the Stochastic signals to determine where to set your take-profit levels. This way, you ensure that you exit the trade while the momentum is in your favor.
  3. Risk-Reward Ratio: A key element of risk management is maintaining a favorable risk-reward ratio. This means that for every trade you take, you should aim for a potential profit that is significantly larger than your potential loss. The Stochastic Oscillator can aid in this by helping you identify entry points with high probability. By using the Stochastic signals to determine entry and exit points, you can calculate and maintain a favorable risk-reward ratio.
  4. Diversification: Diversifying your trading portfolio is another risk management strategy. While the Stochastic Oscillator can be a valuable tool, it’s not infallible, and there’s always the possibility of false signals. To mitigate this risk, consider spreading your investments across different assets and trading strategies. This way, you reduce your exposure to any single trade or market condition.
  5. Position Sizing: Determining the appropriate position size is crucial for risk management. The Stochastic Oscillator can help you identify high-probability trade setups. However, it’s essential to adjust your position size based on your risk tolerance and the specific trade’s parameters. If a trade based on Stochastic signals has a higher probability of success, you might consider a larger position size, but always within your risk limits.

Backtesting and Fine-Tuning Strategies

Backtesting is the process of evaluating a trading strategy using historical market data to determine how it would have performed. It allows traders to assess the viability of their Stochastic Oscillator Strategy without risking real capital. Here’s how backtesting contributes to successful trading:

  • Performance Validation: Backtesting helps validate the effectiveness of your  stochastic oscillator strategy by providing insight into how it would have performed in the past.
  • Risk Assessment: It allows traders to assess the risk associated with the stochastic oscillator strategy, including potential drawdowns and losing streaks.
  • Parameter Optimization: Traders can fine-tune the parameters of their Stochastic Oscillator Strategy based on historical data to improve its performance.
  • Confidence Building: Successful backtesting instills confidence in traders, helping them execute their strategy with discipline and conviction.

The Backtesting Process

Before diving into backtesting, it’s essential to have a clear plan:

  1. Define Your Strategy: Begin by precisely defining your Stochastic Oscillator Strategy, including entry and exit criteria.
  2. Select Historical Data: Choose a relevant dataset that aligns with the markets you intend to trade. Ensure the data is of good quality and includes all the necessary details.
  3. Set Parameters: Configure the parameters of your Stochastic Oscillator indicator in the same way you would in live trading.
  4. Execute the Strategy: Apply your strategy to the historical data and record the trading decisions it generates.
  5. Evaluate Results: Analyze the results of your backtest, including profitability, risk-adjusted returns, and drawdowns.
  6. Iterate and Improve: Use the insights gained from backtesting to fine-tune your strategy. Adjust parameters, risk management rules, or other aspects as needed.

Fine-Tuning Strategies

Fine-tuning involves making adjustments to your Stochastic Oscillator Strategy based on the results of your backtesting. Here’s how you can fine-tune your strategy for optimal performance:

  1. Optimize Parameters: Use the backtesting results to identify the most effective parameter settings for your Stochastic Oscillator indicator. Adjust the values of variables like the lookback period and smoothing to improve accuracy.
  2. Refine Entry and Exit Rules: Analyze your historical trades to identify patterns or conditions that can be refined. This could involve tweaking the criteria for entering or exiting trades.
  3. Enhance Risk Management: Assess your risk management rules, including stop-loss and take-profit levels. Ensure that they align with your risk tolerance and trading objectives.
  4. Consider Market Conditions: Fine-tune your strategy to adapt to different market conditions. Recognize that what works in a trending market may not be suitable for a ranging market.
  5. Diversify Assets: If your backtesting reveals that your strategy performs well on multiple assets, consider diversifying your trading portfolio to spread risk.
  6. Emphasize Discipline: Incorporate the lessons learned from backtesting into your trading discipline. Stick to your strategy and risk management rules consistently.

Common Mistakes to Avoid

Trading with the Stochastic Oscillator Strategy can be highly profitable, but it’s not without its challenges. To ensure your success in implementing this strategy, it’s crucial to be aware of and avoid common mistakes that traders often make. In this section, we’ll delve into these pitfalls, offering insights on how to sidestep them and optimize your trading performance with the Stochastic Oscillator strategy.

1. Overlooking Market Context

Mistake: One of the most common errors is neglecting the broader market context when using the Stochastic Oscillator strategy. Traders may focus solely on Stochastic signals without considering factors like overall market trends, economic events, or news releases.

Solution: Always analyze the bigger picture. Incorporate fundamental analysis and market sentiment into your decision-making process. A Stochastic Oscillator strategy should align with the prevailing market conditions for higher probability trades.

2. Using Stochastic Oscillator in Isolation

Mistake: Relying solely on the Stochastic Oscillator without considering other technical indicators can lead to false signals and missed opportunities.

Solution: Combine the Stochastic Oscillator strategy with other indicators such as Moving Averages or Relative Strength Index (RSI) to validate signals. A confirmation from multiple indicators can increase the reliability of your trades.

3. Overtrading

Mistake: Some traders get caught up in the excitement of frequent Stochastic signals, leading to overtrading. This can result in excessive transaction costs and increased risk.

Solution: Be selective in your trades. Only take positions when the Stochastic Oscillator strategy aligns with your overall trading strategy and risk management rules. Quality over quantity should be your mantra.

4. Ignoring Risk Management

Mistake: Neglecting proper risk management is a grave error. Traders may not set stop-loss orders or take-profit levels, exposing themselves to significant losses.

Solution: Always implement risk management measures. Set stop-loss orders to limit potential losses and take-profit levels to secure profits. Ensure your risk-to-reward ratio is favorable for each trade.

5. Chasing Overbought/Oversold Signals

Mistake: Novice traders often make the mistake of buying immediately when the Stochastic Oscillator strategy indicates oversold conditions or selling when it’s overbought. However, markets can remain in these states for extended periods.

Solution: Wait for a confirmation signal before acting on overbought or oversold conditions. Look for other technical indicators or price patterns to validate the trade setup.

6. Neglecting Divergence Signals

Mistake: Divergence signals, where the Stochastic Oscillator strategy disagrees with price action, are valuable but are sometimes overlooked.

Solution: Pay close attention to divergence signals, as they can indicate potential trend reversals. Regularly scan for these signals in your analysis.

7. Lack of Backtesting and Strategy Evaluation

Mistake: Trading without backtesting your Stochastic Oscillator strategy can be a costly mistake. Traders may not know how their strategy performs under different market conditions.

Solution: Conduct thorough backtesting to assess the historical performance of your Stochastic Oscillator strategy. Evaluate its strengths and weaknesses and make necessary adjustments.

8. Emotional Trading

Mistake: Emotional reactions, such as fear and greed, can cloud judgment and lead to impulsive decisions based on Stochastic signals.

Solution: Stick to a predefined trading plan and rules. Embrace discipline and avoid emotional trading by setting clear entry and exit criteria.

9. Neglecting Education

Mistake: Jumping into Stochastic Oscillator strategy without a deep understanding of the indicator and its nuances can lead to suboptimal results.

Solution: Invest time in learning and practicing with the Stochastic Oscillator strategy. Read books, take courses, and stay updated on market conditions.

10. Overconfidence

Mistake: Overestimating your abilities and the accuracy of the Stochastic Oscillator strategy can lead to unwarranted risks.

Solution: Maintain a humble and realistic approach. Acknowledge that losses are part of trading, even with a sound strategy.

Conclusion

The Stochastic Oscillator Strategy offers a versatile approach to trading, catering to traders of all levels and risk appetites. By understanding its intricacies and deploying it effectively, you can make more informed trading decisions and navigate the markets with greater confidence.

MT4 Divergence Scanner: Simplifying Divergence Analysis on MetaTrader 4

MT4 Divergence Scanner

Introduction 

Trading in today’s dynamic financial markets requires a well-equipped toolkit. Among the essential tools is a reliable trading platform, and MT4 is one of the most widely used choices. It offers a comprehensive range of features and tools, including the highly regarded MT4 Divergence Scanner. But before we dive into the scanner, let’s first understand the concept it revolves around – divergence in trading.

Understanding Divergence in Trading

Divergence, in the context of trading, refers to the discrepancy between price action and the readings of a technical indicator. It can be classified into two main types: regular and hidden divergence. Recognizing divergence is crucial because it often precedes significant price reversals or continuations. In essence, it’s a powerful leading indicator for traders.

The Role of Technical Indicators in Spotting Divergence

In the realm of trading, the ability to spot divergence can be a game-changer. Divergence, as mentioned earlier, refers to the disparity between price action and the readings of technical indicators. It’s a crucial concept because it often serves as an early warning signal for potential trend reversals or continuations. To understand how the MT4 Divergence Scanner operates, it’s essential to explore the role of technical indicators in spotting divergence.

The Power of Technical Indicators

Technical indicators are mathematical calculations based on various aspects of price, volume, or open interest data. They play a vital role in providing traders with insights into the market’s behavior, helping them make informed decisions. Here’s how these indicators contribute to spotting divergence:

  1. Relative Strength Index (RSI): The RSI is one of the most commonly used indicators for identifying divergence. It measures the speed and change of price movements and provides values between 0 and 100. When the RSI diverges from the price action, it can signal potential trend reversals. For instance, if prices are making higher highs while the RSI is making lower highs, it indicates a bearish divergence.
  2. Moving Average Convergence Divergence (MACD): The MACD is another popular indicator that traders use to identify divergence. It consists of two lines: the MACD line and the signal line. When the MACD line diverges from the price action, it can indicate potential reversals or accelerations in the current trend.
  3. Stochastic Oscillator: The Stochastic Oscillator is sensitive to price momentum and is excellent at spotting overbought and oversold conditions. Divergence between the Stochastic Oscillator and price action can signal potential trend changes.

Understanding Regular and Hidden Divergence

Technical indicators play a pivotal role in identifying both regular and hidden divergence. Let’s delve into these two types of divergence:

  • Regular Divergence: Regular divergence occurs when the price makes higher highs (or lower lows) while the oscillator (e.g., RSI, MACD) makes lower highs (or higher lows). This indicates a potential reversal of the current trend. Traders using the MT4 Divergence Scanner can benefit from its ability to detect regular divergence patterns across multiple currency pairs and timeframes simultaneously.
  • Hidden Divergence: Hidden divergence is a bit more complex. It occurs when the price makes lower highs (or higher lows), but the oscillator makes higher highs (or lower lows). Hidden divergence suggests that the current trend is likely to continue. The MT4 Divergence Scanner can assist traders in spotting these hidden divergence patterns, allowing them to ride the trend with confidence.

MT4 Divergence Scanner’s Role in Divergence Analysis

The MT4 Divergence Scanner takes the power of technical indicators to the next level. By scanning multiple currency pairs and timeframes concurrently, it identifies potential divergence patterns in real-time. This automation saves traders significant time and effort that would otherwise be spent manually inspecting charts.

The scanner generates alerts or signals when it detects potential divergence patterns, making it a valuable tool for traders who want to stay ahead of the market. It ensures that traders don’t miss crucial divergence signals, which can lead to more timely and profitable trading decisions.

MT4 as a Trading Platform

MetaTrader 4, or MT4, is a trading platform that has achieved widespread popularity in the financial markets. Its user-friendly interface, advanced charting tools, and support for automated trading strategies make it a top choice among traders. MT4 provides a conducive environment for traders to implement various trading techniques, including divergence analysis.

What Is an MetaTrader4 Divergence Scanner?

Now, let’s shift our focus to the star of the show – the MT4 Divergence Scanner. Simply put, it’s a tool designed to simplify the process of spotting divergence on the MT4 platform. It scans multiple currency pairs, timeframes, and technical indicators simultaneously to identify potential divergence patterns. This means traders no longer need to manually scrutinize charts, saving them valuable time and effort.

Benefits of Using an MetaTrader4 Divergence Scanner

Trading in the fast-paced world of financial markets demands precision, efficiency, and a keen eye for opportunities. It’s no surprise that traders continually seek tools and strategies to enhance their decision-making processes. The MT4 Divergence Scanner emerges as a game-changer, offering a range of significant benefits that can elevate your trading experience. In this section, we’ll delve into the advantages of incorporating an MT4 Divergence Scanner into your trading arsenal.

1. Enhanced Efficiency and Accuracy

One of the primary benefits of utilizing an MT4 Divergence Scanner is the efficiency it brings to your trading routine. Manual divergence analysis can be a time-consuming process, requiring you to scrutinize multiple currency pairs, timeframes, and technical indicators. With the scanner in place, these tasks are automated, saving you valuable time and effort.

Moreover, the scanner’s automated algorithms are designed to identify potential divergence patterns with a high degree of accuracy. It scans price charts and technical indicators simultaneously, leaving little room for oversight. This precision ensures that you don’t miss critical trading opportunities, particularly when time-sensitive decisions are involved.

2. Comprehensive Market Coverage

Trading success often hinges on diversification and the ability to monitor multiple instruments and timeframes simultaneously. The MT4 Divergence Scanner excels in this aspect. It can scan a wide range of currency pairs, commodities, indices, and other financial instruments across various timeframes, all in real-time.

This extensive market coverage enables you to explore a more diverse range of trading opportunities, even in markets you might not have had the bandwidth to track manually. The scanner provides a holistic view of market conditions, helping you make informed decisions across different assets and trading sessions.

3. Timely Recognition of Divergence

Divergence is a powerful leading indicator in trading, often preceding significant price reversals or continuations. Recognizing divergence patterns in a timely manner is crucial for traders seeking to capitalize on these opportunities. The MT4 Divergence Scanner ensures that you receive alerts or signals as soon as potential divergence patterns are identified.

This real-time notification system means that you can act swiftly when divergence signals emerge. It prevents you from having to constantly monitor charts and indicators, allowing you to focus on other aspects of your trading strategy with the confidence that you won’t miss critical divergence-related developments.

4. Objective Analysis

Emotions can cloud judgment in trading, leading to impulsive decisions that may not align with your trading strategy. The MT4 Divergence Scanner provides an objective and systematic approach to divergence analysis. It relies on predefined algorithms and criteria to identify divergence patterns, eliminating the emotional component from the process.

By removing emotional bias, the scanner helps you maintain discipline in your trading approach. You can trust the signals generated by the scanner to be based on objective technical analysis, reducing the risk of impulsive or irrational trading decisions.

5. Customization and Flexibility

Every trader has unique preferences and trading strategies. The MT4 Divergence Scanner recognizes the importance of customization and offers flexibility to adapt to your specific requirements. You can often adjust the scanner’s settings to align with your trading strategy and risk tolerance.

Customization options may include selecting the technical indicators used for divergence analysis, setting threshold levels for divergence detection, and choosing the types of divergence patterns to track. This flexibility allows you to tailor the scanner to your preferred trading style, whether you’re a day trader, swing trader, or long-term investor.

6. Educational Value

Beyond its immediate benefits, the MT4 Divergence Scanner also serves as an educational tool for traders. As you receive divergence signals and study their impact on price movements, you can gain valuable insights into market dynamics and the behavior of specific instruments.

Over time, this hands-on learning experience can contribute to your trading expertise. It enhances your ability to interpret divergence patterns manually when needed, even if you continue to rely on the scanner for efficiency.

7. Risk Management

Effective risk management is a cornerstone of successful trading. The timely recognition of divergence signals provided by the MT4 Divergence Scanner can be instrumental in managing risk. Divergence often indicates potential trend reversals or corrections, allowing you to adjust your positions and risk exposure accordingly.

By acting on divergence signals, you can implement risk mitigation strategies such as setting appropriate stop-loss orders, trailing stops, or adjusting position sizes. This risk-aware approach can help protect your trading capital and minimize potential losses.

8. Competitive Edge

In the competitive world of trading, gaining an edge can make a significant difference in your profitability. The MT4 Divergence Scanner provides you with a competitive advantage by streamlining your divergence analysis process.


Setting Up and Using an MetaTrader4 Divergence Scanner

Setting up and effectively utilizing an MT4 Divergence Scanner is a pivotal step in integrating this powerful tool into your trading strategy. In this section, we’ll guide you through the process of installing, configuring, and maximizing the utility of the scanner, ensuring you can harness its full potential in spotting divergence patterns with precision.

Installing the MT4 Divergence Scanner

  1. Access the Scanner: To begin, ensure that you have access to the MT4 Divergence Scanner of your choice. You can often find reputable scanners through online trading communities, brokers, or software providers.
  2. Download the Indicator: Once you’ve identified a suitable scanner, download the indicator file (usually in .ex4 or .mq4 format) to your computer.
  3. Install on MT4: Open your MetaTrader 4 platform. From the ‘File’ menu, select ‘Open Data Folder.’ Inside the ‘MQL4’ folder, you’ll find a ‘Indicators’ directory. Copy the downloaded scanner indicator file into this ‘Indicators’ folder.
  4. Refresh MT4: Close and reopen your MT4 platform or select ‘Refresh’ from the ‘Navigator’ panel on the left-hand side. This action ensures that the MT4 platform recognizes the new indicator.

Configuring the Scanner

  1. Attach the Scanner to a Chart: To use the MT4 Divergence Scanner on a specific chart, right-click on the chart you wish to analyze. From the context menu, select ‘Indicators,’ then the name of your installed scanner.
  2. Adjust Settings: Most scanners offer customizable settings. These settings may include the choice of technical indicators, timeframes, and the type of divergence (regular or hidden) you want to scan for. Configure these settings according to your trading preferences.
  3. Save Presets: If your scanner allows, save your preferred scanner settings as presets. This can expedite your analysis on different charts or instruments in the future.

Maximizing Utility

  1. Interpreting Scanner Signals: The MT4 Divergence Scanner typically generates signals or alerts when it detects divergence patterns. Familiarize yourself with how these signals are presented on your MT4 platform, whether through pop-up notifications, sound alerts, or visual cues on the chart.
  2. Analyzing Divergence Patterns: When a scanner identifies a divergence pattern, don’t rush into a trade. Use the information as a starting point for your analysis. Confirm the signal with additional technical and fundamental analysis, ensuring it aligns with your overall trading strategy.
  3. Risk Management: Remember that no tool, including the scanner, is foolproof. Implement sound risk management practices to protect your capital. Determine your stop-loss and take-profit levels based on your analysis and risk tolerance.
  4. Continuous Learning: The effectiveness of the MT4 Divergence Scanner improves with experience. Continuously monitor how well the scanner’s signals align with actual market movements. Adjust your trading approach based on your observations and results.
  5. Stay Informed: Keep an eye on software updates and improvements for your scanner. Developers may release enhancements that can further enhance its functionality.
  6. Combine with Other Tools: While the scanner is a valuable tool, consider combining it with other technical indicators and analyses for a more comprehensive view of the market.

Common Technical Indicators Supported by MetaTrader4 Divergence Scanners

When it comes to using an MT4 Divergence Scanner for effective trading, understanding the technical indicators it supports is paramount. These indicators play a vital role in divergence analysis, helping traders spot potential reversals or continuations in price trends. Here, we explore some of the common technical indicators that are typically supported by MT4 Divergence Scanners and how they enhance the scanner’s functionality.

1. Relative Strength Index (RSI)

The Relative Strength Index (RSI) is a popular momentum oscillator that measures the speed and change of price movements. It oscillates between 0 and 100 and is often used to identify overbought and oversold conditions. When the RSI value crosses certain thresholds (typically 70 for overbought and 30 for oversold), it can signal a potential divergence.

With an MT4 Divergence Scanner, traders can use RSI divergence as a key component of their strategy. The scanner can automatically detect when the RSI is diverging from price action, providing valuable signals for traders to consider.

2. Moving Average Convergence Divergence (MACD)

The Moving Average Convergence Divergence (MACD) is another popular indicator that combines two moving averages to identify changes in momentum. Divergence between the MACD and price action can signal shifts in trend direction. For instance, if the MACD is making higher highs while prices are making lower highs, it could indicate a potential bearish divergence.

MT4 Divergence Scanners often support MACD analysis, making it easier for traders to spot these divergence patterns. The scanner can identify when the MACD and price are moving in opposite directions, alerting traders to potential trade opportunities.

3. Stochastic Oscillator

The Stochastic Oscillator is a momentum indicator that compares a security’s closing price to its price range over a specific period. It generates values between 0 and 100, with readings above 80 indicating overbought conditions and readings below 20 signaling oversold conditions. Divergence between the Stochastic Oscillator and price can provide insights into potential reversals.

An MT4 Divergence Scanner can simplify the process of monitoring the Stochastic Oscillator for divergence. It can automatically scan multiple currency pairs and timeframes, highlighting instances where the oscillator’s behavior diverges from price action.

4. Commodity Channel Index (CCI)

The Commodity Channel Index (CCI) is an oscillator that measures the variation of a security’s price from its statistical mean. It typically oscillates between -100 and +100, with readings above +100 suggesting overbought conditions and readings below -100 indicating oversold conditions. Divergence between CCI and price can offer valuable trading signals.

By supporting CCI analysis, an MT4 Divergence Scanner empowers traders to identify instances where CCI divergence aligns with their trading strategy. This automated approach saves time and ensures that potential divergence opportunities are not missed.

5. Relative Momentum Index (RMI)

The Relative Momentum Index (RMI) is a lesser-known but effective oscillator for identifying divergence. It combines the principles of the RSI and the Stochastic Oscillator to measure momentum. Divergence between RMI and price can be a reliable indicator of potential trend changes.

MT4 Divergence Scanners that include RMI analysis expand a trader’s toolkit. Traders can rely on the scanner to identify RMI divergence patterns across multiple instruments and timeframes.

6. Average Directional Index (ADX)

The Average Directional Index (ADX) is used to gauge the strength of a trend. When the ADX diverges from price action, it can signal a potential weakening or strengthening of a trend. Divergence in ADX can be a valuable precursor to trend reversals or continuations.

Incorporating ADX divergence analysis within an MT4 Divergence Scanner provides traders with a holistic view of market dynamics. It ensures that traders are alerted to potential shifts in trend strength based on ADX readings.

7. Ichimoku Cloud

The Ichimoku Cloud is a comprehensive indicator that includes multiple components, such as the Tenkan-sen, Kijun-sen, Senkou Span A and B, and the Chikou Span. Divergence involving any of these components can provide insights into potential price reversals or continuations.

Trading Strategies with MetaTrader4 Divergence Scanner

1. Divergence-Based Reversal Trading

One of the most common trading strategies with the MT4 Divergence Scanner is divergence-based reversal trading. When the scanner detects regular divergence, which suggests a potential trend reversal, traders can initiate trades in the direction opposite to the prevailing trend.

For example, if the scanner identifies regular bearish divergence (higher highs in price but lower highs on the indicator), it may signal an upcoming bearish reversal. Traders can then consider shorting the currency pair. Conversely, if bullish regular divergence is detected, traders might look for long opportunities.

2. Trend Confirmation with Hidden Divergence

While regular divergence signals potential reversals, hidden divergence indicates a continuation of the current trend. Traders can use the MT4 Divergence Scanner to confirm the strength of an existing trend.

For instance, if the scanner identifies hidden bullish divergence (lower lows in price but higher lows on the indicator) in an uptrend, it suggests that the upward momentum is likely to continue. Traders can use this information to add to their long positions or enter new ones, aligning with the prevailing trend.

3. Divergence Confluence with Support and Resistance

Incorporating support and resistance levels into divergence trading can enhance the accuracy of entries and exits. When the MT4 Divergence Scanner identifies divergence near significant support or resistance levels, it provides traders with valuable confluence.

For example, if the scanner detects regular bearish divergence and the price is approaching a strong resistance level, this combination strengthens the bearish bias. Traders can consider shorting the currency pair with more confidence, knowing that multiple factors align in favor of the trade.

4. Multiple Timeframe Divergence Analysis

Divergence signals become more potent when confirmed across multiple timeframes. Traders can use the MT4 Divergence Scanner to identify divergence patterns on a higher timeframe for overall trend direction and on a lower timeframe for precise entry points.

For instance, if the scanner detects regular bullish divergence on the daily chart, indicating a potential long-term trend reversal, traders can look for entry opportunities on the hourly or 15-minute chart. This multi-timeframe approach allows for better timing and risk management.

5. Risk Management and Stop-Loss Placement

Regardless of the trading strategy employed with the MT4 Divergence Scanner, risk management remains paramount. Traders should use proper position sizing and place stop-loss orders to protect their capital.

When entering a trade based on divergence signals, consider placing the stop-loss just beyond the recent swing high or low, depending on the direction of the trade. This ensures that if the trade goes against you, losses are limited.

6. Continuous Monitoring and Adaptation

Market conditions can change rapidly, and divergence signals may vary in reliability. Traders using the MT4 Divergence Scanner should continuously monitor their chosen currency pairs and adjust their strategies as needed.

This adaptation may involve altering the parameters of the scanner, fine-tuning entry and exit criteria, or switching between different types of divergence (regular or hidden) based on evolving market dynamics.

Risks and Considerations

1. False Signals

One of the primary concerns when using any trading tool, including the MT4 Divergence Scanner, is the possibility of false signals. False signals occur when the scanner identifies a divergence pattern that doesn’t result in a significant price movement or reversal. These signals can lead traders to make incorrect trading decisions, resulting in losses.

Mitigation: To minimize the impact of false signals, traders should use the scanner in conjunction with other technical and fundamental analyses. Combining divergence signals with additional confirmatory indicators or chart patterns can help filter out false signals and enhance the accuracy of your trades.

2. Over-reliance on Automation

The automation offered by the MT4 Divergence Scanner can be a double-edged sword. While it streamlines the process of identifying divergence patterns, it can also lead to over-reliance on the scanner and reduced critical thinking. Traders may become complacent and fail to conduct thorough analyses beyond what the scanner provides.

Mitigation: Maintain an active and engaged role in your trading. Use the scanner as a complementary tool rather than a standalone solution. Continue to perform manual analyses and stay informed about market news and events that may impact your trading decisions.

3. Market Volatility

Market conditions can change rapidly, and periods of high volatility can affect the accuracy of divergence signals generated by the scanner. Sudden price spikes or erratic movements can result in false signals or unexpected reversals.

Mitigation: Be mindful of market volatility and consider adjusting the settings of the scanner to align with the current market conditions. During highly volatile periods, it may be prudent to use wider stop-loss and take-profit levels to account for potential price swings.

4. Technical Limitations

No trading tool is infallible, and the MT4 Divergence Scanner has its technical limitations. These limitations can include occasional glitches, delays in signal generation, or compatibility issues with specific versions of the MT4 platform.

Mitigation: Stay informed about updates and patches for the scanner to address any technical issues. Additionally, consider using a reputable and well-maintained scanner that has a track record of reliability.

5. Overtrading

The ease of generating divergence signals with the scanner may tempt traders to overtrade. Overtrading can lead to increased transaction costs (spread and commission), higher exposure to risks, and emotional exhaustion.

Mitigation: Implement a disciplined trading plan with clear entry and exit criteria. Use the scanner’s signals as part of your overall strategy, and avoid making impulsive trades based solely on scanner-generated signals.

6. Psychological Impact

Trading can be emotionally challenging, especially during periods of losses or drawdowns. Relying solely on the MT4 Divergence Scanner can distance traders from the emotional aspect of trading, potentially leading to a disconnect from the market’s psychological dynamics.

Mitigation: Maintain self-awareness and emotional discipline in your trading. Keep a trading journal to record your thoughts and emotions during trades, even when using the scanner. Seek support and guidance from trading mentors or communities to address psychological challenges.

7. Risk Management

Effective risk management is paramount in trading. The scanner may provide valuable signals, but traders must have a robust risk management strategy in place to protect their capital.

Mitigation: Define your risk tolerance and set appropriate stop-loss and take-profit levels for each trade. Avoid risking more than a predefined percentage of your trading capital on a single trade. Additionally, consider using position sizing techniques to control risk.

Choosing the Right MetaTrader4 Divergence Scanner

Compatibility with MT4 Platform

First and foremost, ensure that the scanner you choose is fully compatible with the MetaTrader 4 (MT4) platform. While most scanners are designed for MT4, it’s essential to verify this compatibility to avoid any technical glitches or compatibility issues. A seamless integration with MT4 is critical for the scanner to function optimally.

Supported Technical Indicators

Divergence analysis relies heavily on technical indicators, as they are the foundation for identifying divergence patterns. When evaluating an MT4 Divergence Scanner, examine the range of technical indicators it supports. The more diverse the indicator options, the better equipped you’ll be to analyze different markets and trading instruments effectively. Look for a scanner that offers compatibility with popular indicators such as the Relative Strength Index (RSI), Moving Average Convergence Divergence (MACD), and the Stochastic Oscillator.

Customization Options

Flexibility and customization are key when it comes to an MT4 Divergence Scanner. Traders have unique trading styles and preferences, and the scanner should cater to those individual needs. Look for a scanner that allows you to adjust settings and parameters to fine-tune divergence detection. Customization options should include the ability to specify timeframes, choose the types of divergence to scan for (regular or hidden), and set alert preferences. The more control you have over these settings, the better you can tailor the scanner to your trading strategy.

User-Friendly Interface

A user-friendly interface is paramount, especially for traders who are relatively new to divergence analysis or the MT4 platform. The scanner should present divergence signals in a clear and understandable manner. Visual cues, such as color-coded signals or pop-up alerts, can significantly enhance the user experience. Additionally, an intuitive interface simplifies the process of configuring the scanner and adjusting settings.

Reliability and Accuracy

Accuracy is non-negotiable when it comes to divergence analysis. A reliable MT4 Divergence Scanner should deliver accurate signals consistently. Look for reviews and user feedback to gauge the reliability of the scanner you’re considering. It’s advisable to opt for scanners that have a track record of providing high-quality divergence signals.

Alert Mechanisms

Timely notifications are crucial in the fast-paced world of trading. Evaluate the alert mechanisms offered by the scanner. It should be capable of generating real-time alerts when divergence patterns are identified. These alerts can be in the form of sound notifications, on-screen pop-ups, email alerts, or even push notifications to your mobile device. The ability to receive alerts ensures that you never miss a potential trading opportunity.

Support and Updates

Check if the scanner is backed by a responsive customer support team. In case you encounter any issues or have questions about its functionality, prompt support can be invaluable. Additionally, inquire about the availability of regular updates and maintenance for the scanner. The financial markets are constantly evolving, and an up-to-date scanner is essential for accurate analysis.

Price and Value

Last but not least, consider the price of the MT4 Divergence Scanner in relation to the value it offers. While cost is a factor, it should not be the sole determinant. Assess the features, customization options, accuracy, and support provided by the scanner to determine its overall value. A higher-priced scanner with advanced features and exceptional support may provide a better return on investment in the long run.

Conclusion

The MT4 Divergence Scanner is a game-changer for traders who seek to streamline their divergence analysis and make more informed trading decisions. By automating the process of identifying divergence patterns, it offers a significant advantage in today’s fast-paced markets. As you embark on your journey with this innovative tool, remember that effective trading involves continuous learning and adaptation to market conditions.

Triple Bollinger Bands Strategy: Unveiling the Key to Enhanced Market Analysis

Triple Bollinger Bands Strategy

Introduction

In the dynamic landscape of trading, professionals persistently strive to fine-tune their approaches to decipher market trends more proficiently. The Triple Bollinger Bands Strategy emerges as a beacon for those aiming to amplify their analytical skills. Before diving deep into this strategy, let’s first familiarize ourselves with the rudimentary aspects of Bollinger Bands and how the concept has escalated to incorporate triple bands.

Understanding the Basics

At the heart of the Triple Bollinger Bands Strategy lies the basic premise of Bollinger Bands, which involves utilizing three bands to identify potential buy and sell signals in the market. A quintessential representation of volatility, these bands broaden and contract based on the market’s volatility. This section endeavors to introduce readers to the core constituents of this strategy: the middle band and the two outer bands, which are designated as plus and minus two standard deviations.

Conceptual Foundation

To harness the full potential of the Triple Bollinger Bands Strategy, traders need to have a robust understanding of the fundamental concepts that govern it. A significant aspect here is grasping the concept of historical volatility, which stands as a cornerstone in interpreting the behavior of these bands. As we delve deeper, we will unravel how standard deviations play a pivotal role in shaping this strategy and assisting in volatility assessment.

Setting Up the Triple Bollinger Bands

Embarking on the journey of using the triple Bollinger bands strategy necessitates a deep understanding of its setup process. From the novice trader to the seasoned professional, having a comprehensive setup is instrumental to successfully deploy this intricate strategy. In this deep dive, we’ll walk through each step to ensure you’re equipped to leverage the full potential of the triple Bollinger bands strategy in your trading ventures.

Understanding the Fundamentals

At the core of the triple Bollinger bands strategy is the basic Bollinger Bands indicator, which uses a middle band (simple moving average) and two outer bands representing standard deviation levels. The triple Bollinger bands strategy takes this a step further, incorporating three separate sets of Bollinger Bands to offer a more detailed analysis of price movements.

Selecting the Appropriate Parameters

A foundational step in the setup process of the triple Bollinger bands strategy is parameter selection. While the default setting for the middle band is typically a 20-period simple moving average, traders often tweak these settings based on their trading style and the asset they’re analyzing. The same goes for the standard deviation settings for the outer bands. Fine-tuning these parameters will significantly affect the sensitivity and signals generated by the strategy.

Configuring the Triple Bands on Your Trading Platform

Most modern trading platforms will offer the Bollinger Bands indicator as a default tool. However, to set up the triple Bollinger bands strategy, you’ll often need to add the Bollinger Bands indicator thrice, each with its unique settings. Here’s a step-by-step guide:

  1. First Band Configuration: Start by adding the Bollinger Bands indicator to your chart. This first set could use the default settings, serving as your primary point of reference.
  2. Second Band Configuration: Add another Bollinger Bands indicator. You might decide to adjust the standard deviation to a higher or lower setting, depending on your preference for tighter or wider bands.
  3. Third Band Configuration: Implement the third set, potentially opting for an even broader deviation or focusing on a more narrowed view. The choice here depends on how detailed or zoomed out you want your triple Bollinger bands strategy analysis to be.

Visualizing and Customizing Appearance

A crucial aspect of using the triple Bollinger bands strategy effectively is ensuring that you can clearly distinguish between each set of bands on your chart. Most trading platforms will allow you to adjust the color, thickness, and style of each band. It’s advisable to use contrasting colors or styles to ensure that each set of bands is easily identifiable.

Testing and Adjusting Your Setup

Once you’ve configured the triple Bollinger bands strategy on your chart, it’s time to test it out. Scroll through historical data and observe how the price interacts with each set of bands. Do the bands provide meaningful support and resistance levels? Are there clear signals where the price crosses specific bands? If the bands seem too tight or too loose, consider revisiting your parameter settings.

Integrating the Triple Bollinger Bands with Other Tools

While the triple Bollinger bands  is a powerful tool on its own, integrating it with other technical indicators can further enhance its efficacy. For instance, combining the bands with volume indicators or momentum oscillators can help confirm signals and reduce the chances of false positives.

Interpreting the Bands

Interpreting the bands in the triple Bollinger bands strategy is crucial to leveraging its capabilities to the fullest. By adeptly reading and understanding the movements and contractions of the bands, traders can gain valuable insights into potential market trends, allowing them to make more informed decisions. Here’s a deep dive into how to interpret these bands effectively.

The Anatomy of the Triple Bands

First and foremost, it’s essential to understand the core structure of the bands used in the triple Bollinger bands strategy. The strategy consists of three separate bands:

  1. The Middle Band: Representing the simple moving average, this band is a central point of reference. Typically, it’s calculated over a predetermined period, with 20 days being the standard.
  2. The Upper Band: Situated two standard deviations above the middle band, the upper band reflects potential overbought conditions in the market.
  3. The Lower Band: Positioned two standard deviations below the middle band, the lower band indicates potential oversold scenarios.

By grasping the nuances of these bands, users of the triple Bollinger bands strategy can identify market fluctuations with greater clarity.

Band Squeezes and Expansions

A crucial aspect of interpreting the bands in the triple Bollinger bands strategy is recognizing band squeezes and expansions. When the bands converge or squeeze, it signals a period of low volatility, often implying that a significant price move is on the horizon. Conversely, when the bands expand or diverge, it indicates heightened market volatility, suggesting the current trend is gaining momentum.

Navigating Overbought and Oversold Scenarios

The triple Bollinger bands strategy excels in identifying potential overbought and oversold conditions in the market. When the price touches or moves above the upper band, it can indicate an overbought scenario, suggesting a potential price correction might be impending. Conversely, if the price touches or dips below the lower band, it might be indicative of an oversold condition, hinting at a possible price rebound.

Middle Band as the Trend Indicator

While the upper and lower bands often steal the spotlight in the triple Bollinger bands strategy, the middle band shouldn’t be overlooked. Acting as a reflection of the market’s current trend, if the price remains above the middle band, it suggests an ongoing bullish trend. However, if it stays below the middle band, it indicates a bearish trend.

Confirming the Strategy with Volume

For those aiming to maximize the efficacy of the triple Bollinger bands strategy, considering trading volume can be instrumental. For instance, during a band squeeze, if the volume starts to increase, it can be a prelude to a significant price movement. Contrarily, in a band expansion scenario, a decreasing volume might signify the potential end of the current trend.

Trading Signals with Triple Bollinger Bands

Basics of the Triple Bollinger Bands Strategy

Before diving deep into the trading signals, it’s crucial to understand the foundation of the triple bollinger bands strategy. This strategy essentially amplifies the standard Bollinger Bands tool by using three sets of bands. Each set comprises a middle band, representing a simple moving average, and two outer bands, which are standard deviations away from the middle band. This results in a total of nine bands, providing traders with a broader perspective on potential market movements.

Recognizing Potential Buy and Sell Zones

One of the hallmarks of the triple bollinger bands  is its ability to delineate potential buy and sell zones with clarity. When the price of an asset gravitates towards the upper bands, it might signal an overbought scenario, hinting at a potential price reversal. Conversely, when the price veers towards the lower bands, it could be an indication of an oversold condition, suggesting a potential upward price movement.

Trend Identification Using the Triple Bollinger Bands Strategy

A crucial aspect of trading is the identification of prevailing market trends. The triple bollinger bands  serves as an invaluable tool in this regard. When the bands are parallel, and the price remains confined within them, it indicates a stable trend. However, if the price pierces through the bands, it might signal a potential trend shift. This ability to visualize trend strength and potential reversals is what makes the triple bollinger bands strategy a preferred choice among seasoned traders.

Band Squeezes and Expansions

Band squeezes occur when the bands come close together, indicating decreased market volatility. This phase is often a precursor to significant price movements. On the other hand, band expansions, where the bands move apart, suggest increased volatility and potential continuation of the ongoing trend. The triple bollinger bands provides traders with a bird’s-eye view of these phases, enabling them to make more informed trading decisions.

Avoiding False Signals with the Triple Bollinger Bands Strategy

While the triple bollinger bands  is a potent tool, it’s also imperative for traders to be vigilant of false signals. There might be instances where the price momentarily breaches the bands but retraces quickly. Such scenarios require traders to combine the insights from the triple bands with other technical analysis tools to filter out potential false alarms.

Benefits of the Triple Bollinger Bands Strategy

At its core, the triple Bollinger bands  uses three Bollinger bands, which are essentially three standard deviations from the moving average of a security’s price. These bands represent different levels of volatility and can be a game-changer in deciphering trading signals.

  • Upper Band: This is set two standard deviations above the middle band and can often signify overbought conditions.
  • Middle Band: Represents the simple moving average of a security’s price.
  • Lower Band: Positioned two standard deviations below the middle band, it can typically indicate oversold conditions.

Deciphering Buy and Sell Signals

With the triple Bollinger bands strategy, traders can discern multiple signals:

  1. Band Crossovers: When the price crosses above the upper band, it can indicate a strong upward momentum, signaling a potential buy. Conversely, when the price dips below the lower band, it may suggest a selling point.
  2. Band Contraction and Expansion: The proximity of the bands to each other can provide insights into market volatility. A contracting band might hint at reduced volatility, often preceding significant price movements. An expanding band, meanwhile, signifies increased volatility, alerting traders to potential risks or opportunities.
  3. Reversions to the Mean: Often, after the price reaches the outer bands, there is a reversion to the mean, or the middle band. Recognizing this pattern can aid traders in setting appropriate stop-loss or take-profit points.

Enhanced Signal Accuracy

One of the compelling advantages of the triple Bollinger bands strategy is the potential for increased signal accuracy. By utilizing three bands, traders can gain a more detailed perspective on price movements, allowing for more informed decisions.

Integrating Other Indicators

While the triple Bollinger bands strategy is potent on its own, its efficacy can be further enhanced when integrated with other technical indicators. For instance, combining it with momentum oscillators can offer traders insights into the strength of potential buy or sell signals.

Practical Tips

For those keen on implementing the triple Bollinger bands strategy, here are some practical tips:

  • Stay Informed: As with any strategy, it’s essential to stay updated with market news. External factors can significantly impact price movements, and the more informed you are, the better your decisions will be.
  • Practice Makes Perfect: Before diving headfirst into the market, consider using a demo account to familiarize yourself with the triple Bollinger bands strategy. This hands-on approach can offer invaluable insights.
  • Risk Management: Never put all your eggs in one basket. Ensure that you’re diversifying your investments and setting appropriate stop-loss points to mitigate potential losses.

Combining Triple Bollinger Bands with Other Technical Indicators

1. Triple Bollinger Bands and Moving Averages

Moving averages, both simple and exponential, are amongst the most popular technical indicators in a trader’s toolkit. By integrating moving averages with the triple Bollinger Bands strategy, traders can obtain a clearer perspective on the prevailing market trend. While the triple Bollinger Bands offer insights into potential overbought or oversold conditions, the moving averages can validate these signals by showcasing the direction and strength of the underlying trend. This combined approach helps traders differentiate between genuine breakout or breakdown and mere noise in the price action.

2. The Role of RSI (Relative Strength Index) with Triple Bollinger Bands

The RSI is another invaluable indicator that measures the momentum and speed of price movements. When the RSI is used in conjunction with the triple Bollinger Bands strategy, traders can glean insights into potential momentum shifts in the market. For instance, if the price touches the upper band while the RSI indicates overbought conditions, this could be a potent signal of an impending price correction. This synergy ensures traders aren’t solely relying on one tool and can cross-verify signals before making trading decisions.

3. MACD (Moving Average Convergence Divergence) Enhancing the Triple Bollinger Bands 

The MACD, which highlights the relationship between two moving averages of a security’s price, can serve as a momentum oscillator when paired with the triple Bollinger Bands strategy. This combination is especially effective when detecting potential trend reversals. As the triple Bollinger Bands offer insights into volatility and potential breakout zones, the MACD can validate these breakouts by showcasing whether they come with genuine momentum or are false alarms. This pairing reduces the likelihood of traders getting caught in fakeouts.

4. Stochastic Oscillator’s Collaboration with Triple Bollinger Bands

The Stochastic Oscillator is adept at identifying potential trend reversals based on the positioning of the closing price relative to its recent range. By marrying this tool with the triple Bollinger Bands strategy, traders can fine-tune their entry and exit points. If the price is near the upper band and the Stochastic Oscillator indicates overbought conditions, traders might consider it as an optimal exit or short-selling opportunity. Conversely, when the price is near the lower band with the Oscillator indicating oversold conditions, it could be an ideal buying juncture.

5. Enhancing Precision with the Volume Oscillator

Volume plays a pivotal role in validating the strength behind price movements. By integrating the Volume Oscillator with the triple Bollinger Bands , traders can gauge the legitimacy of a breakout or breakdown. A substantial spike in volume, coinciding with the price breaching one of the bands, typically augments the reliability of that move.

Limitations and Cautions

Over-reliance on Bands for Signals

A common pitfall associated with the triple Bollinger bands strategy is the tendency for traders to become overly reliant on the bands themselves for trading signals. While the bands can indicate potential oversold or overbought conditions, it’s a mistake to think they provide foolproof buy or sell signals. Over-relying on any tool can lead to missed opportunities or worse, financial losses.

Potential for False Signals

Like any technical analysis tool, the triple Bollinger bands strategy isn’t immune to producing false signals. Markets can remain in overbought or oversold conditions longer than a trader’s financial resilience can sustain. It’s crucial for traders to understand that while the bands provide a visual representation of market conditions, they do not predict the future.

Historical Volatility Doesn’t Predict Future Moves

The triple Bollinger bands  relies heavily on historical data and volatility. However, just because an asset has behaved a certain way in the past doesn’t guarantee it will continue to do so. External factors such as geopolitical events, economic data releases, and corporate announcements can significantly influence price movement.

Requires a Steeper Learning Curve

The added complexity of using three bands instead of the traditional two means that the triple Bollinger bands strategy has a steeper learning curve. For newcomers to technical analysis, understanding how to interpret the nuances of three bands can be challenging. Misinterpreting the data can lead to misguided trades.

Cautions When Using the Triple Bollinger Bands Strategy

  1. Integration with Other Tools: Solely relying on the triple Bollinger bands  can be a risky endeavor. It’s often beneficial to integrate the insights from this strategy with other technical analysis tools or even fundamental analysis to get a holistic view of the market.
  2. Risk Management: Using the triple Bollinger bands strategy doesn’t negate the need for robust risk management. Setting stop-loss points and only investing what one can afford to lose remains paramount.
  3. Continuous Education: As with all trading strategies, continuous education is key. Markets evolve, and the effectiveness of tools can shift over time. Traders should always strive to stay updated on the latest techniques and best practices associated with the triple Bollinger bands .
  4. Stay Updated: Economic calendars, news events, and market shifts can all influence how assets move within the bands. Traders using the triple Bollinger bands  should always be aware of upcoming events that could impact their positions.

Conclusion

As we reach the culmination of this enlightening journey, it becomes evident that the Triple Bollinger Bands holds a pivotal role in modern trading. It beckons traders to integrate this multifaceted tool into their trading arsenal and test its capabilities in a controlled setup before embarking on full-scale implementation. As we bid adieu, we encourage traders to embrace the Triple Bollinger Bands Strategy as a viable means to foster informed and calculated trading decisions.